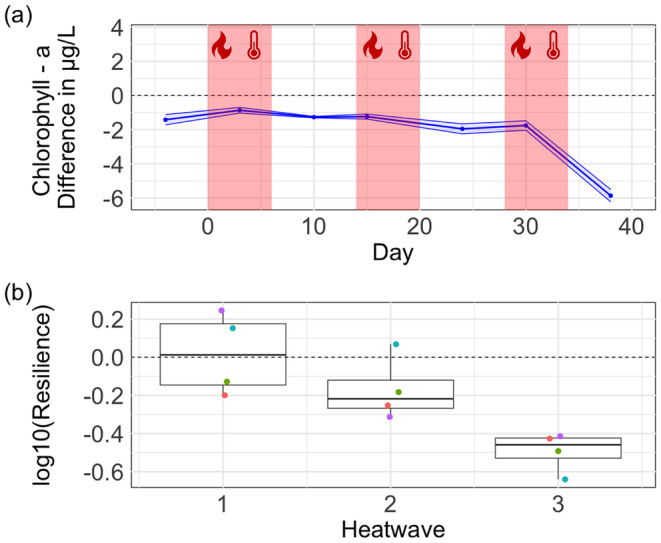
FIGURE 3.

Chlorophyll a concentration dynamic over time. (a) shows the difference in Chlorophyll a between mesocosms undergoing the HW treatment and the control mesocosms (dashed line at zero). The red areas show the three heatwaves. (b) Boxplot of resilience of Chlorophyll a after each HW. Coloured dots represent the different mesocosms. Values of resilience > 0 mean increased resilience (HW and control mesocosms became more similar after a HW), whereas values of resilience < 0 mean decreased resilience (HW and control mesocosms became more dissimilar after a HW).
