FIGURE 6.

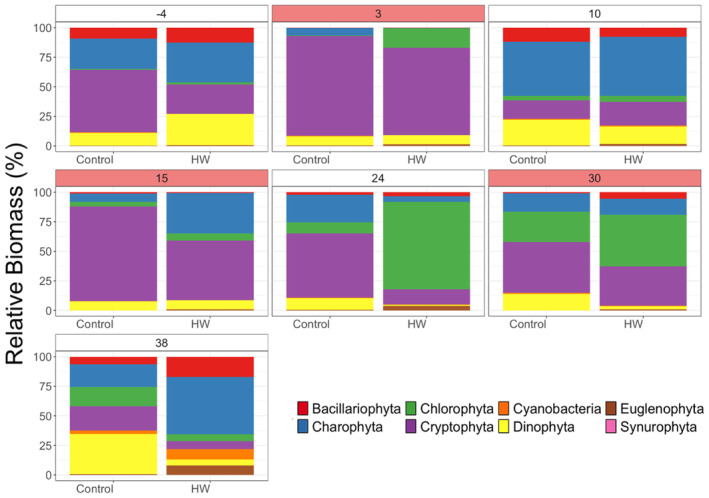
Mean relative biomass of different phytoplankton taxa in the control and the mesocosms exposed to HWs in different time points of the experiment. Day facets in white represent non‐HW days, whereas light red facets represent HW days.

Mean relative biomass of different phytoplankton taxa in the control and the mesocosms exposed to HWs in different time points of the experiment. Day facets in white represent non‐HW days, whereas light red facets represent HW days.