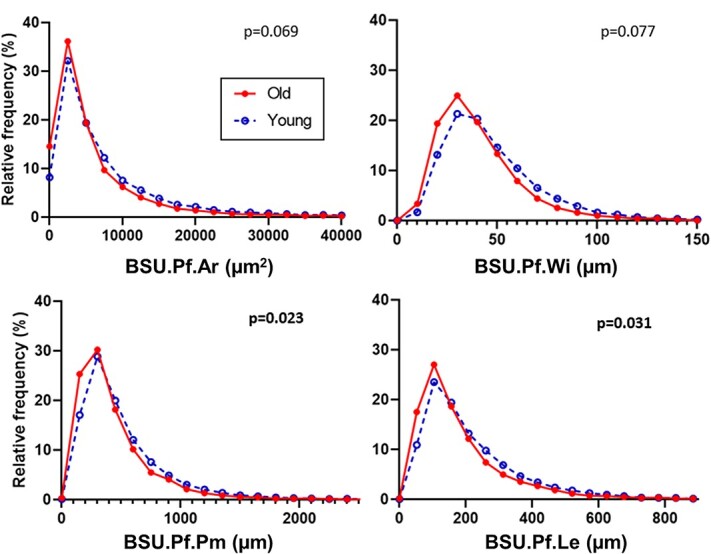
Figure 2.

Frequency distribution of BSU.Pf.Ar, BSU.Pf.Wi, BSU.Pf.Pm, and BSU.Pf.Le within L2 vertebrae from 8 younger women (aged 19-38 yr) and 8 older women (aged 69-96 yr). The frequency plots are not normalized to account for different numbers of BSU per individual; however, the p-values are for the nested analyses (GROUP → INDIVIDUAL → TRABECULAR PROFILE) which do. Abbreviation: BSU, bone structural unit.
