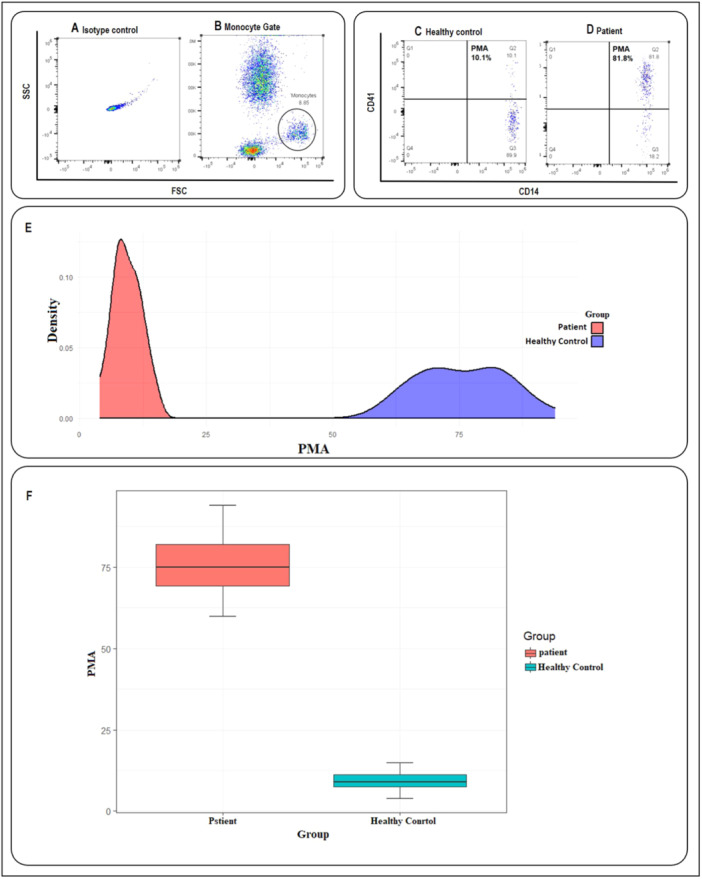
Figure 1.

The platelet–monocyte aggregates (PMA) formation in healthy control and acute coronary syndromes (ACS) patients. (A) Isotype control. (B) Monocytes were initially gated based on characteristic forward scatter (FSC) and side scatter (SSC), as indicated within the circle. The population of cells co‐expressing CD14 and CD41 markers was identified as PMA, as illustrated in (C and D). (C) An example of the amount of PMA in a healthy control. (D) An example of the amount of PMA in an ACS patient. (E) The density plot showing the effectiveness of the parameters in distinguishing between patient and healthy groups, the red curve for the patient group and a blue curve for the healthy control group. (F) The box plot showing the comparison of PMA averages in patients (red box) and healthy volunteers (blue box) (75.78 ± 8.74 in patients vs. 9.35 ± 2.8 in controls, p < 0.001).
