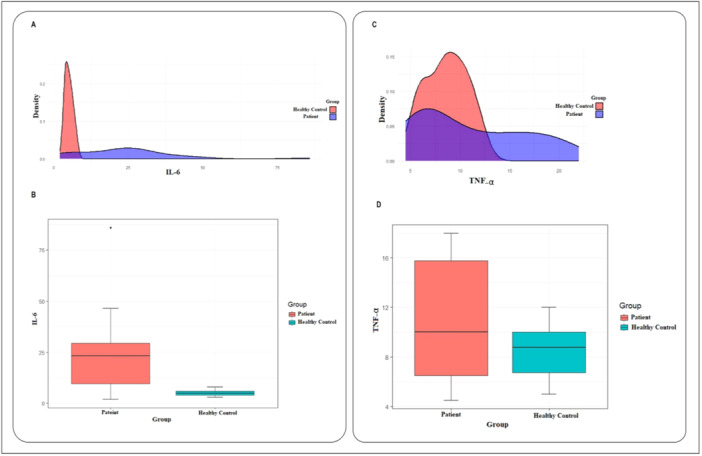
Figure 3.

The interleukin‐6 (IL‐6) and tumor necrosis factor α (TNF‐α) plasma levels in healthy control and acute coronary syndromes (ACS) patients. (A) The density plot for IL‐6 in the patient group (blue curve) and healthy control (red curve). (B) The box plot showing the comparison of IL‐6 averages in patients (red box) and healthy control (blue box) (23.52 ± 17.13 in patients vs. 5.04 ± 1.35 in controls, p < 0.001). (C) The density plot for TNF‐α in the patient group (blue curve) and healthy control (red curve). (D) The box plot showing the comparison of TNF‐α average in patients (red box) and healthy control (blue box) (10.69 ± 4.77 in patients vs. 8.60 ± 2.07 in controls, p > 0.05).
