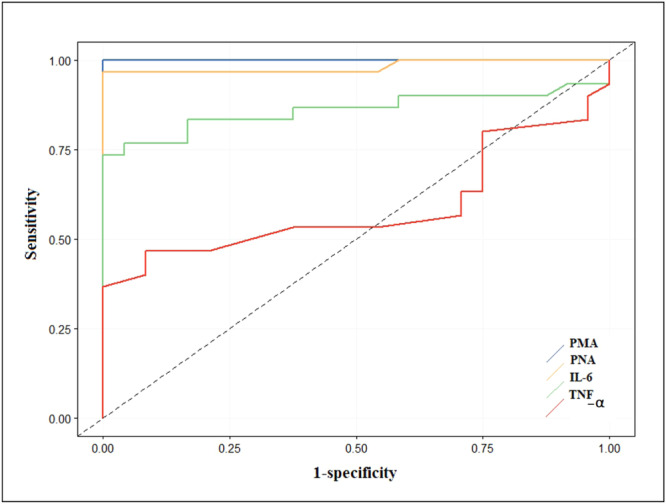
Figure 5.

Receiver operating characteristic (ROC) curve analysis of PMA, platelet–neutrophil aggregates (PNA), IL‐6, and TNF‐α in acute coronary syndromes (ACS) patients. The receiver operating characteristic (ROC) curve shows that PMA with the area under the curve (AUC) = 1 (blue line) and PNA with an AUC = 0.982 (yellow line) and IL‐6 with AUC = 0.859 (green line) together are reliable and powerful markers in differentiating the group of patients with ACS and healthy controls, and TNF‐α with AUC = 0.588 (red line) is less effective in differentiating between the two groups.
