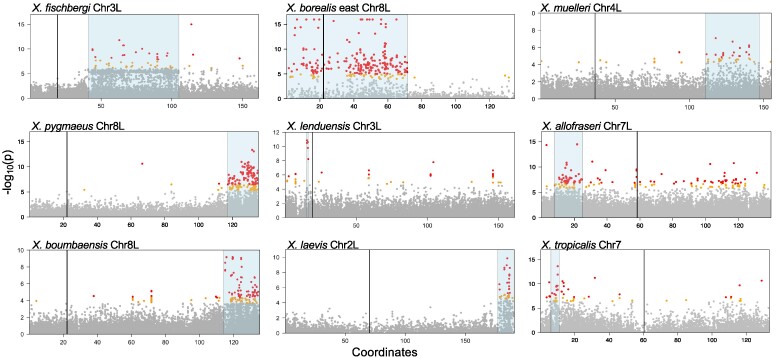
Fig. 2.
Eight nonhomologous sex-associated regions in nine Xenopus species based on analyses of genetic association and sex specificity (RADsex; see main text), including five newly described here. Gray, orange, and red dots indicate the −log10 transformed probability (P) for a test of whether each SNP is associated with sex, and correspond to >0.1%, 0.1–0.05%, or the <0.05% percentiles, respectively, across genome-wide RRGS variants for each species. Sex-associated regions supported by association tests and RADsex analysis are highlighted in blue; centromere locations of the reference genomes are indicated with vertical lines. These plots show only the sex chromosomes for each species; plots of the whole genome for each species are provided in supplementary fig. S1, Supplementary Material online. Except for X. lenduensis, data from all species depicted here are at least partially from lab-bred families.

