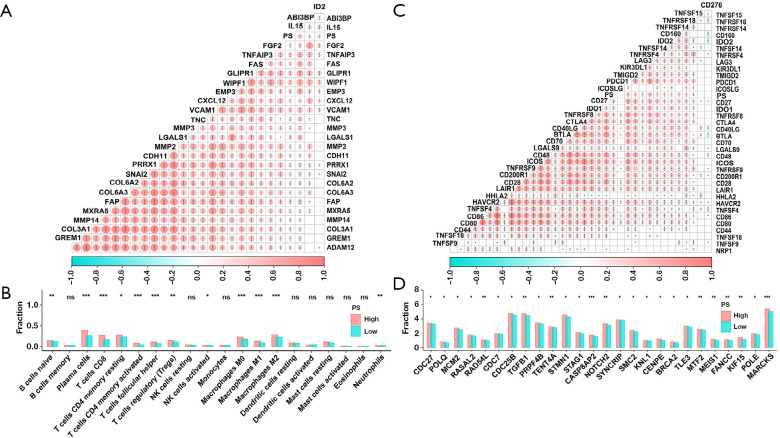
Figure 5.
The correlation between PS and pathway gene analysis. (A) Investigation of the relationship between PS and EMT gene expression. (B) Immune cell abundance differences between groups with high and low PS. (C) Correlation analysis of PS high and low groups and immune checkpoint expression. (D) Difference analysis between the PS high and low groups and G2/M checkpoint. ns, not significant; *, P<0.05; **, P<0.01; ***, P<0.001. PS, pathomics score; EMT, epithelial-mesenchymal transition.

