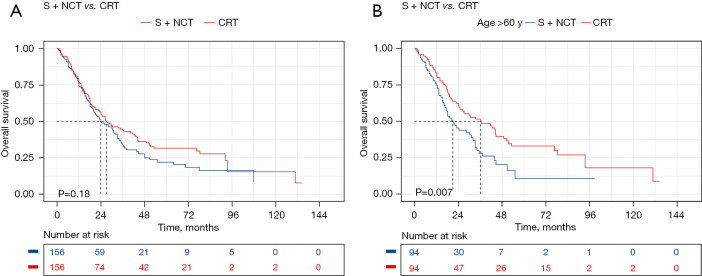
Figure 2.
Survival analysis of surgical vs. non-surgical groups after PSM. (A) Surgical vs. non-surgical group Kaplan-Meier curves; (B) Kaplan-Meier curves for patients aged >60 years in the surgical vs. non-surgical groups. PSM, propensity score matching; S, upfront surgery; NCT, neoadjuvant chemotherapy; CRT, chemoradiotherapy.

