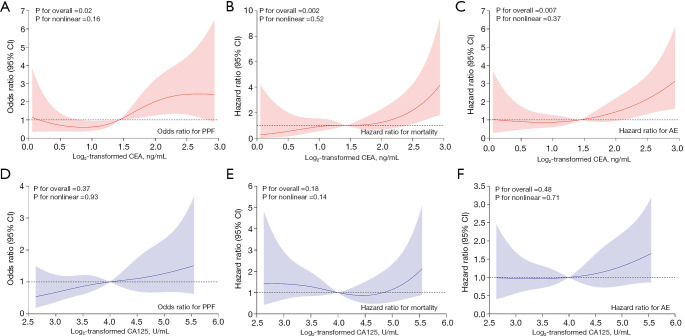
Figure 4.
Restricted cubic spline for CEA and CA125 with PPF. (A) The dose-response relationships of concentrations CEA with the risk of PPF in patients with CTD-ILD. (B) The dose-response relationships of concentrations CEA with the risk of all-cause mortality in patients with CTD-ILD. (C) The dose-response relationships of concentrations CEA with the risk of AE in patients with CTD-ILD. (D) The dose-response relationships of concentrations CA125 with the risk of PPF in patients with CTD-ILD. (E) The dose-response relationships of concentrations CA125 with the risk of all-cause mortality in patients with CTD-ILD. (F) The dose-response relationships of concentrations CA125 with the risk of AE in patients with CTD-ILD. Models were adjusted for age, pulmonary hypertension, honeycombing, emphysema and DLCO% pred. The P value for overall <0.05 manifested a significant association, whatever the shape of the dose-response curve was. The P value for non-linear <0.05 indicated a nonmonotonic dose-response curve. CEA, carcinoembryonic antigen; CI, confidence interval; PPF, progressive pulmonary fibrosis; AE, acute exacerbation; CA125, carbohydrate antigen 125; CTD, connective tissue disease; ILD, interstitial lung disease; DLCO% pred., percent predicted for diffusion capacity of the lung for carbon monoxide.

