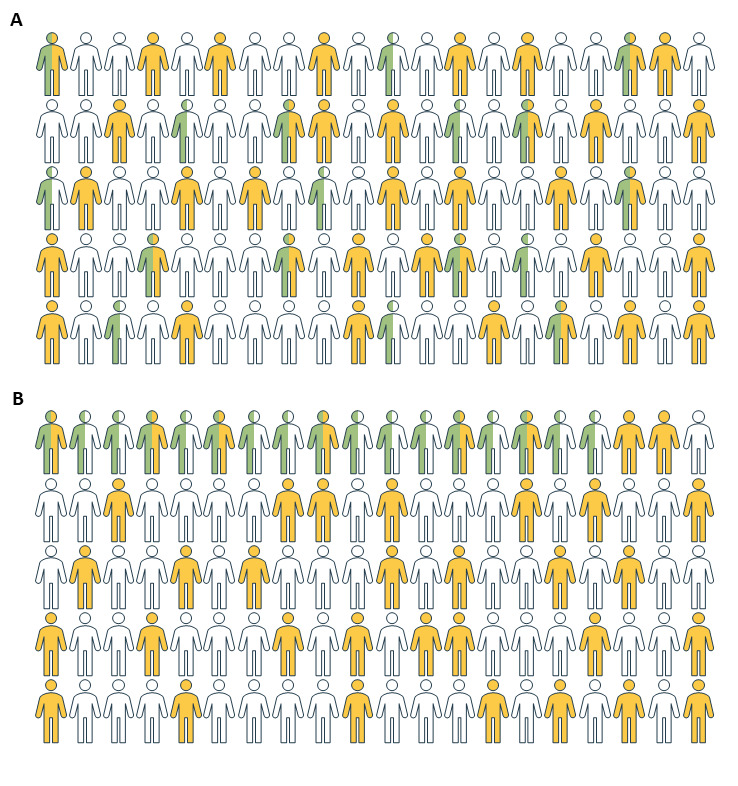
Figure 5.

Comparison of the (A) MED-REC predictor to (B) random selection. Calculations are based on the classification measures of the temporal validation. A probability threshold of 0.45 was used, considering limited staffing resources for medication reconciliation in our hospitals. Patients with at least 1 clinically relevant discrepancy are presented in yellow. Patients without clinically relevant discrepancies are presented in white. Medication reconciliation is performed for patients in green. (A) If the MED-REC predictor is applied to 100 patients, 17 will be identified as high risk, alerting the pharmacist to perform a medication reconciliation. For 9 of these patients (17×0.55), at least 1 clinically relevant medication discrepancy will be found. (B) When a medication reconciliation is performed for 17 randomly selected patients, at least 1 clinically relevant medication discrepancy will be found in 6 patients (17×0.37). Eleven patients, as opposed to 8 with the MED-REC predictor, would not have needed the pharmacy staff’s intervention.
