
Table 4.
Equation of the MED-REC predictor estimating the probability of having at least 1 clinically relevant discrepancy. The shape of the formula is 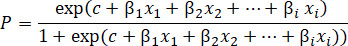 , where P is the probability of having at least 1 clinically relevant discrepancy, c is the intercept, xi is the predictor variable and βi is the corresponding β coefficient. For each predictor variable, the β coefficient, odds ratio, 95% CI, and the P value are presented.
| Variable | Coefficient | ORa (95% CI) | P value | ||||
| Intercept | –1.82 | 0.16 (0.08 to 0.30) | <.001 | ||||
| Age (years) | 0.012 | 1.01 (1.00 to 1.02) | .02 | ||||
| Residence of the patient before admission (reference category: home) | |||||||
|
|
Residence of the patient (nursing home) | –0.96 | 0.38 (0.15 to 0.90) | .03 | |||
|
|
Residence of the patient (other) | –0.79 | 0.45 (0.06 to 2.25) | .36 | |||
|
|
Number of drugs reported by the EDb physician | –0.094 | 0.91 (0.83 to 0.99) | .04 | |||
|
|
Number of “ATC A”c drugs reported by the ED physician (alimentary tract and metabolism) | 0.276 | 1.32 (1.13 to 1.55) | <.001 | |||
|
|
Number of “ATC C” drugs reported by the ED physician (cardiovascular system) | 0.167 | 1.18 (1.02 to 1.37) | .03 | |||
|
|
Number of “ATC N” drugs reported by the ED physician (nervous system) | 0.206 | 1.23 (1.06 to 1.42) | .005 | |||
|
|
Number of “ATC P” drugs reported by the ED physician (antiparasitic products insecticides and repellents) | 1.712 | 5.54 (1.07 to 41.4) | .05 | |||
|
|
Number of “ATC R” drugs reported by the ED physician (respiratory system) | 0.269 | 1.31 (1.09 to 1.58) | .004 | |||
aOR: odds ratio.
bED: emergency department.
cATC: Anatomical Therapeutic Chemical.