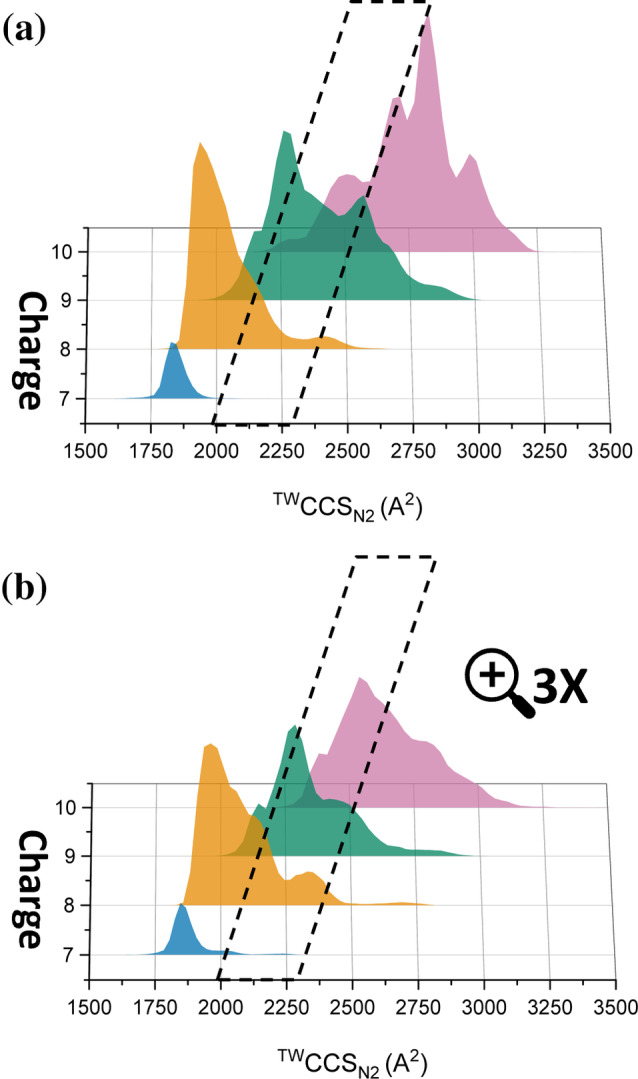
FIGURE 5.

CCS distributions of (a) unbound AR‐TAU5, (b) EPI‐001‐bound AR‐TAU5 charge states. The black box highlights an intermediate conformational space, that is more highly populated by AR‐TAU5 in the presence of EPI‐001 via elongation of charge states 7+ and 8+ and compaction of 9+ and 10+. The height of each CCS distribution corresponds to the relative intensity of the corresponding peak in the mass spectrum shown in Figure 3b, with the bottom panel being magnified 3x due to the low signal intensity for the protein:molecule complex.
