Figure 1.
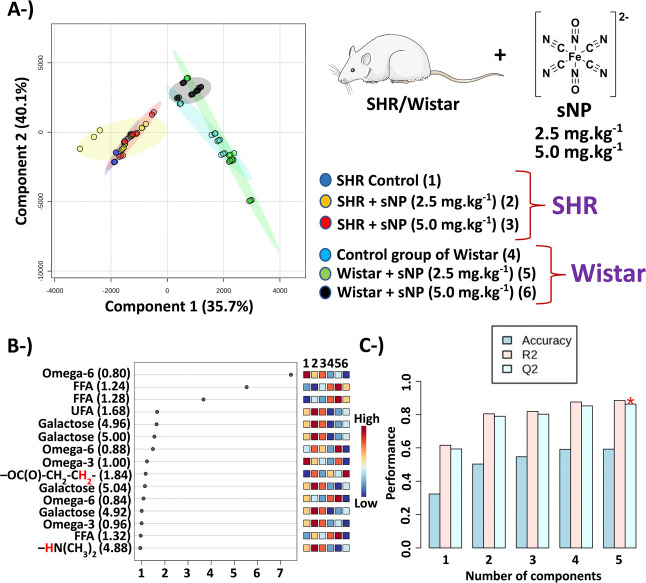
Results of the PLS-DA of the six groups. (A) Scores graph – 4 samples of the SHR untreated control group (dark blue color, group 1) + 5 samples of SHR + sNP 2.5 mg kg–1 (yellow color, group 2) + 4 samples of SHR + sNP 5.0 mg kg–1 (red color, group 3) + 4 samples of the Wistar untreated control group (cyan color, group 4) + 5 samples of Wistar + sNP 2.5 mg kg–1 (green color, group 5) + 5 samples of Wistar + sNP 5.0 mg kg–1 (black color, group 6) using a spectral range between 0.50 and 6.00 ppm with exclusion of 1.50–1.68 ppm and 4.63–4.81 ppm. (B) VIP scores. (C) The PLS-DA cross-validation with the accuracy of 59.3%; Q2 = 0.86 and R2 = 0.89 using 5 components. Abbreviations: FFA – free fatty acids; UFA – unsaturated fatty acids. P.S.: The image of the rat is available at the link smart.servier.com (free medical images).

