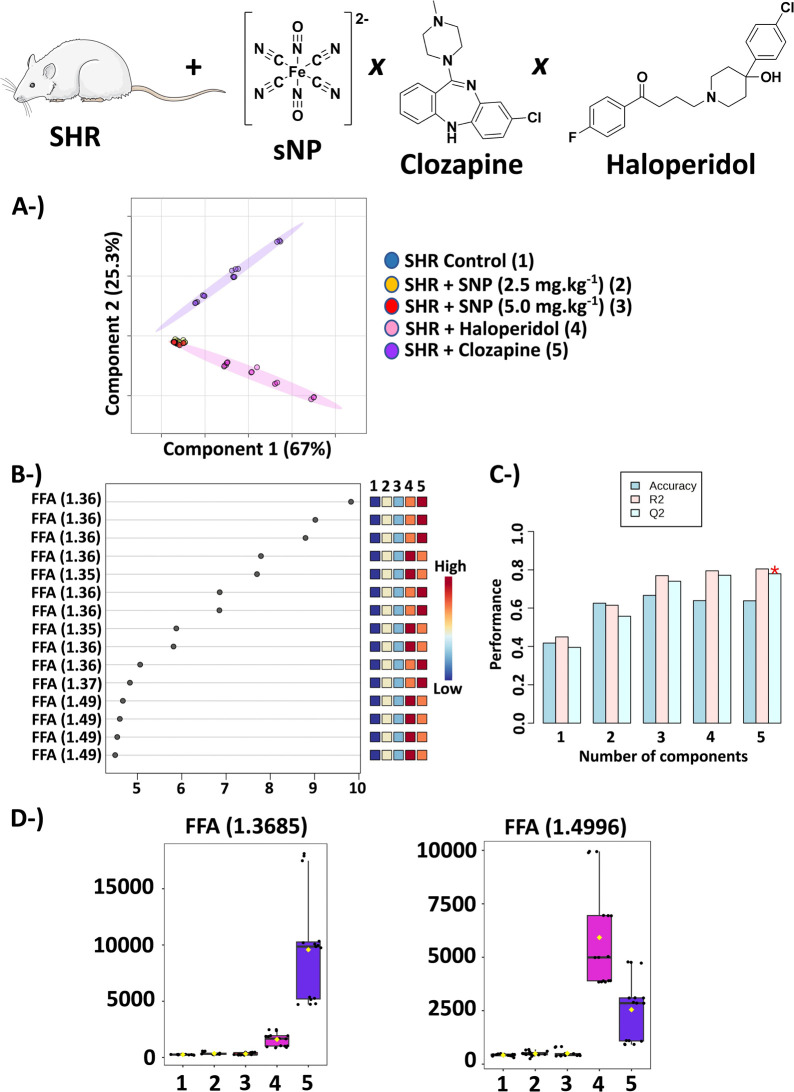
Figure 2.
The results of the PLS-DA of SHR treated with sNP, haloperidol, and clozapine. (A) Scores graph (2D) – 4 samples of the untreated SHR control group (dark blue color, group 1) + 5 samples of SHR + sNP 2.5 mg kg–1 (yellow color, group 2) + 4 samples of SHR + sNP 5.0 mg kg–1 (red color, group 3) + 5 samples of SHR + haloperidol (pink color, group 4) + 5 samples of SHR + clozapine (purple color, group 5) using a spectral range between 1.30 and 2.60 ppm with exclusion of 1.50–1.68 ppm. (B) VIP scores. (C) The PLS-DA cross-validation with the accuracy of 63.8%; Q2 = 0.78 and R2 = 0.80 using 5 components. (D) Box plots of the original concentration of variables δ = 1.36 and 1.49, which were assigned to FFA. Abbreviation: FFA – free fatty acids.

