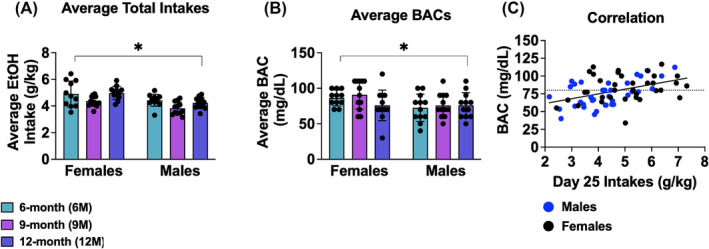
FIGURE 2.

Depiction of the sex and age differences in alcohol intake and corresponding BAC levels. (A) Female mice consumed more alcohol on average over the 30‐day drinking period compared to males, with no significant interaction between sex and age. (B) BAC levels measured on day 25, with females displaying higher BACs than males, reflecting the sex‐specific intake patterns seen with total intake. (C) Scatter plot demonstrating a positive correlation between alcohol intake and BAC on day 25 in this study. The dotted line in (C) represents the legal intoxication threshold. Figures show means ± SEMs. *p < 0.05, female versus male.
