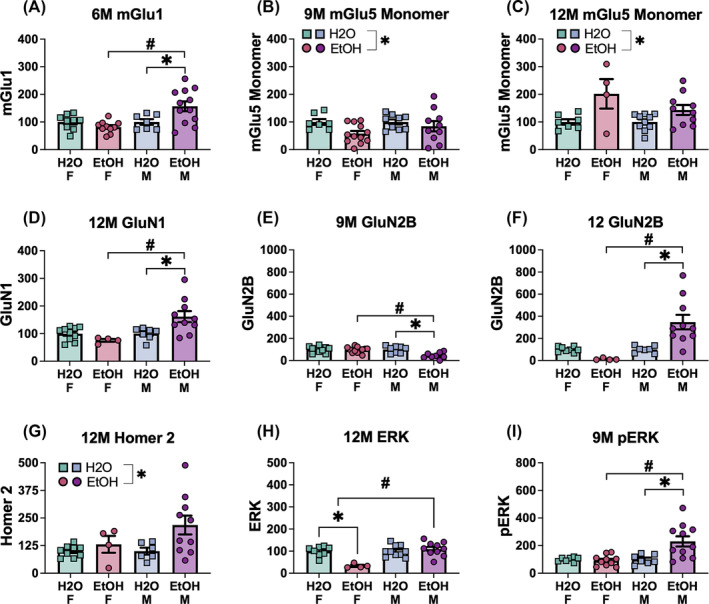
FIGURE 6.

Summary of the significant effects of the sex by drinking history ANOVA on the expression of glutamate‐related proteins in the entorhinal cortex. Group 1 mGlu receptors: (A) 6M mGlu1 and (B,C) 9M and 12M mGlu5 (monomer), the NMDA receptor subunits: (D) 12M GluN1, (E,F) 9M and 12M GluN2B, (G) 12M Homer 2a/b, (H) 12M ERK and (I) 9M pERK. Data represent means ± SEMs, with specific significant interactions and main effects highlighted. *p < 0.05, EtOH versus H2O; # p < 0.05, age difference.
