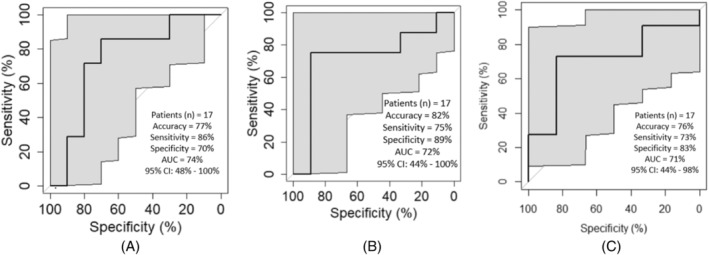
FIGURE 2.

(A) ROC curve representing the performance of the predictive model when using top 8 of 24 LASSO features to predict overall survival. (B) ROC curve representing the performance of the predictive model when using top 10 of 22 LASSO features to predict progression‐free survival. (C) ROC curve representing the performance of the predictive model when using top 8 of 55 LASSO features to predict disease control (CR/PR/SD vs. PD).
