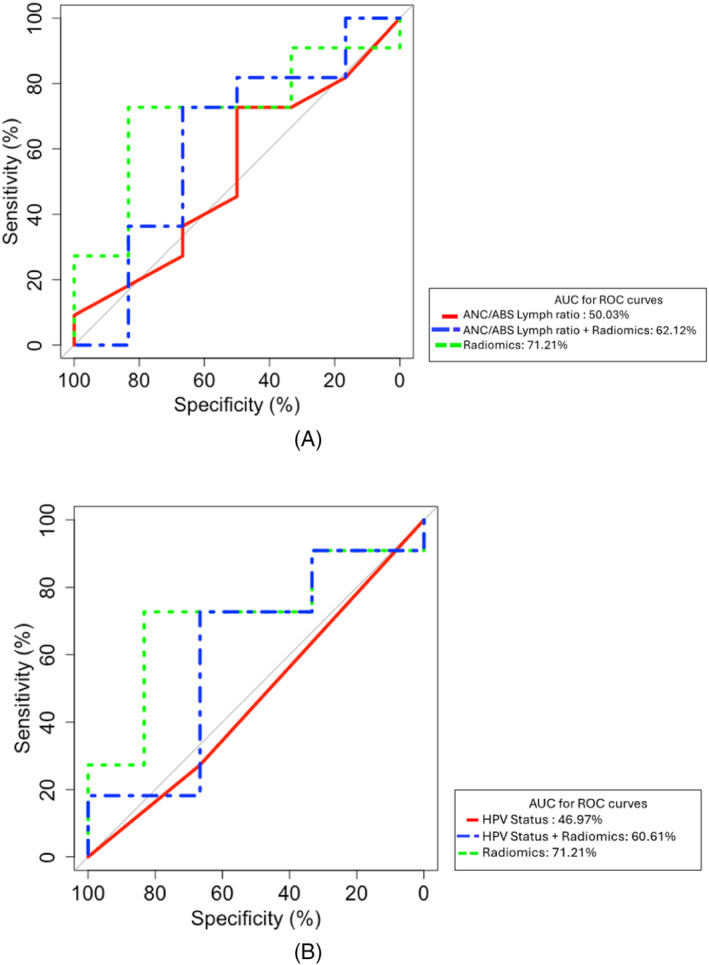
FIGURE 3.

(A) ROC curve representing the performance of the radiomics predictive model compared to Neutrophil/Lymphocyte ratio for disease control (CR/PR + SD vs. PD). (B) ROC curve representing the performance of the radiomics predictive model compared to HPV status (positive vs. negative) for disease control (CR/PR + SD vs. PD).
