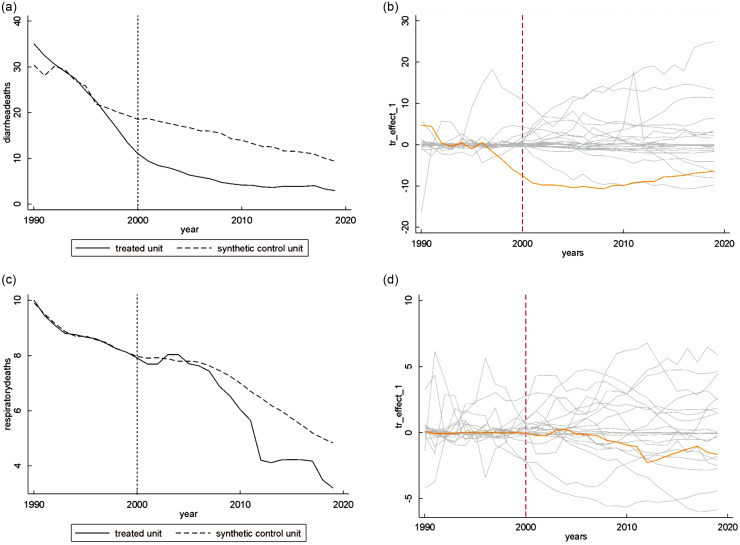
Fig. 1.
The figure shows the development over time for Ghana and its synthetic control group in terms of child mortality by diarrhea (1A) and lower respiratory infections (1C). The vertical line shows the implementation of the International Code of Marketing of Breast-Milk Substitutes. On the right we depict the difference between Ghana and its synthetic control (orange) and show placebo estimates for the donor pool (gray) to assess statistical significance

