
Figure 5.
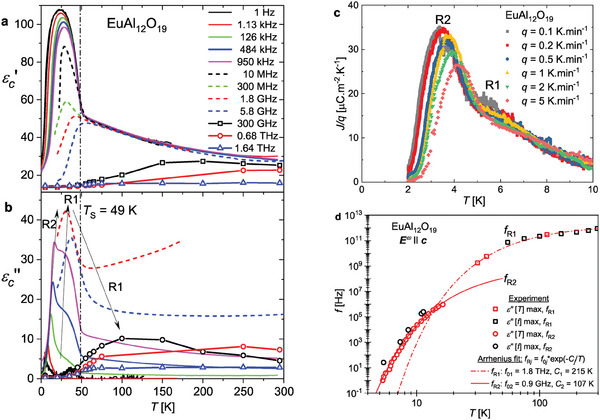
Temperature dependence of a) the real part and b) the imaginary part of the dielectric permittivity at various frequencies. The relaxations R1 and R2 are indicated by a broad maximum and a sharp peak in . c) Pyroelectric currents density divided by the heating rate q for different heating rates. The crystal was cooled under an electric field of E = 3.2 kV cm−1 along the c axis. d) Temperature dependence of the f R1 and f R2 relaxation frequencies obtained as positions of maxima from either measured at a particular temperature or spectra measured at a particular frequency. The lines are two Arrhenius fits.