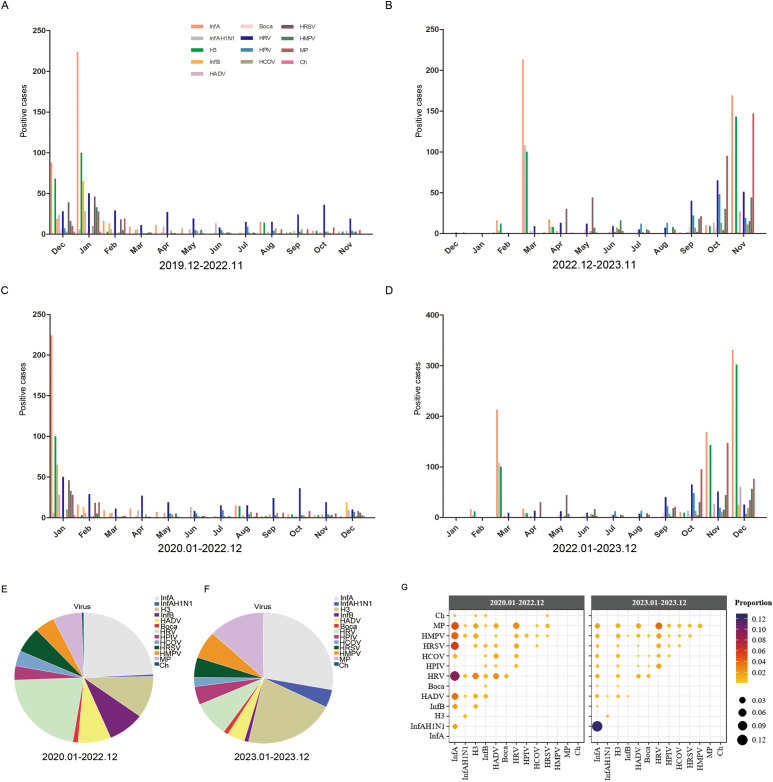
Figure 3.
The monthly distribution of different respiratory pathogens. (A) The monthly distribution of different respiratory pathogens from December 2019 to November 2022. (B) The monthly distribution of different respiratory pathogens from December 2022 to November 2023. (C) The monthly distribution of different respiratory pathogens from January 2022 to December 2022. (D) The monthly distribution of different respiratory pathogens from January 2023 to December 2023. (E) The proportions of different pathogens from January 2022 to December 2022. (F) The porportions of different pathogens from January 2023 to December 2023. (G) The proportion of each co-infection pair among all co-infected samples shown by color and size from January 2022 to December 2022 and January 2023 to December 2023. Positive cases refers to the number of positive patients.

