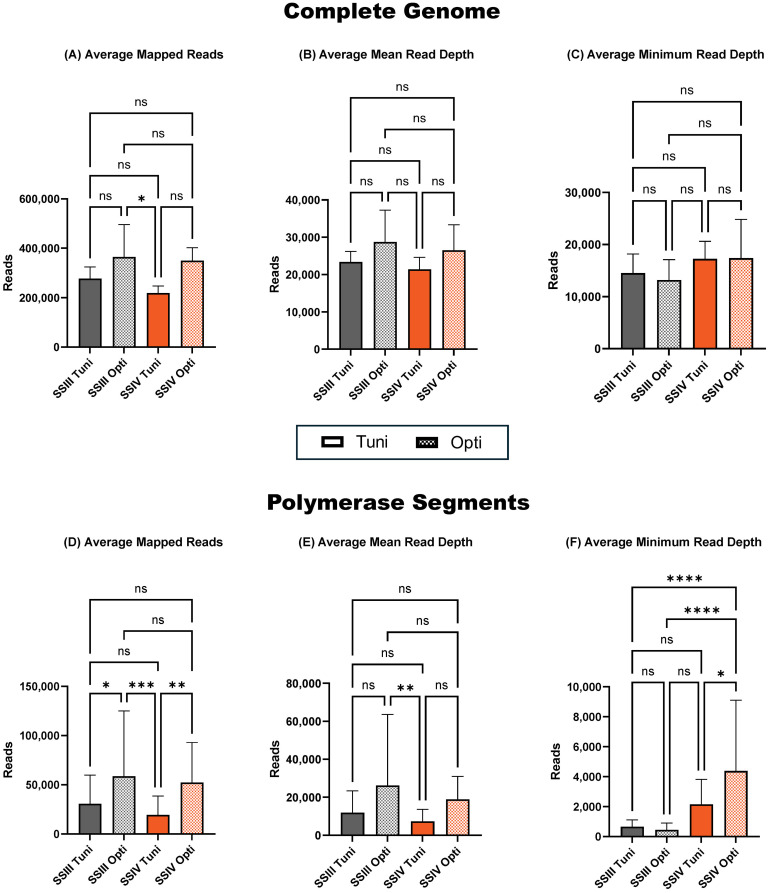
Figure 2.
Sequencing summary for comparison of Tuni and Opti primer sets' performance on complete genome and polymerase segments. Average mapped avian influenza A reads for the complete genome (A) and polymerase segments (D) of six different avian influenza viruses. Average avian influenza A genome mean read depth for the complete genome (B) and polymerase segments (E). Average avian influenza A minimum read depth for the complete genome (C) and polymerase segments (F). P-value is defined as follows: *p ≤ 0.05, **p ≤ 0.01, ***p ≤ 0.001, ****p ≤ 0.0001.

