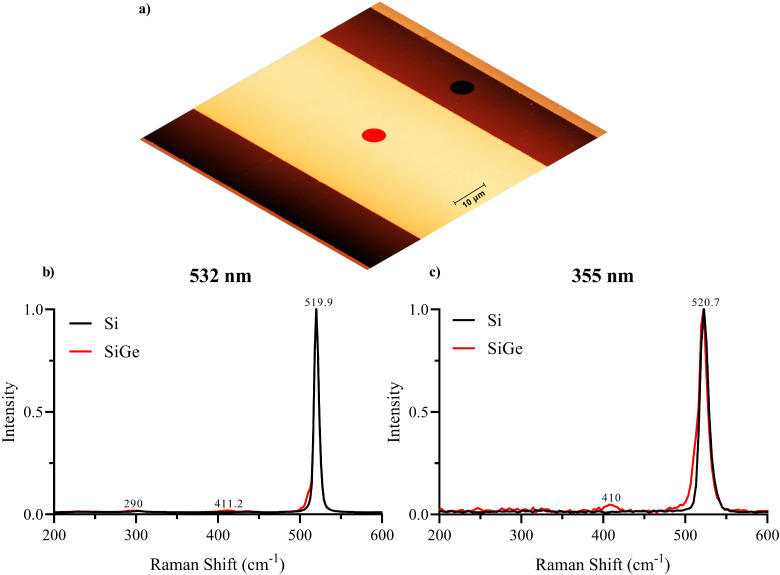
Figure 2.
(a) Schematic of the section and the position of the point measurements on the two different regions, i.e., SiGe (red spot) and Si (black spot); (b, c) comparison between local Raman acquisitions collected from the two different regions (SiGe in red and Si in black) with the 532 nm and 355 nm excitation wavelengths, respectively.

