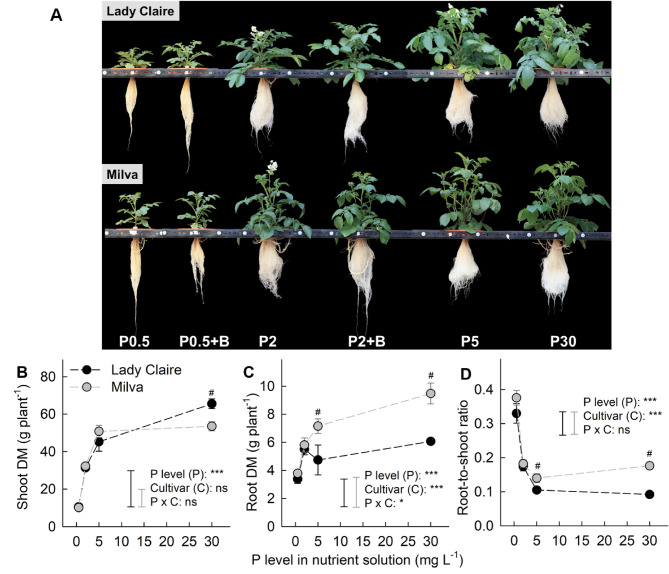
Fig. 1.
Effects of P availability and B. subtilis on plant growth. (A) Plant phenotypes and biomass of the potato cultivars Lady Claire and Milva as affected by P availability and B. subtilis inoculation, showing the effect of varying P levels (0.5, 2, 5, and 30 mg L− 1) on the (B) shoot DM, (C) root DM, and (D) root-to-shoot ratio of the cultivars. Values represent the mean ± SE (n = 5). ns, *, and *** indicate non-significant and significant differences at p < 0.05 and p < 0.001, respectively. Black and grey vertical bars represent critical values for comparisons among P treatments of each cultivar by Tukey’s HSD test at p < 0.05. # indicates a significant difference between cultivars at the same P level, while no indication means non-significant difference. B = B. subtilis, DM = dry matter

