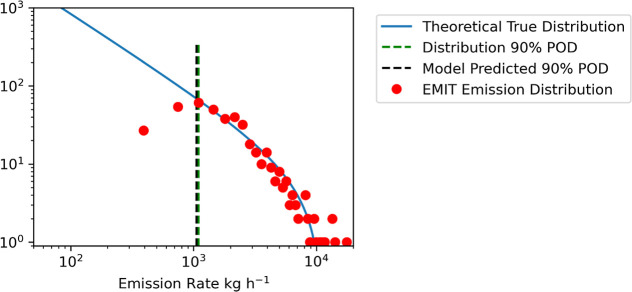
Figure 2.
Distribution of all quantified methane emission from EMIT for wind speeds under 4 and over 2 at time of analysis (n = 422, bins = 50). The Model Predicated 90% POD is the 90% POD at 3 from the model in eq 4. The distribution 90% POD is where we estimate the EMIT distribution starts to diverge from a theoretical true distribution.

