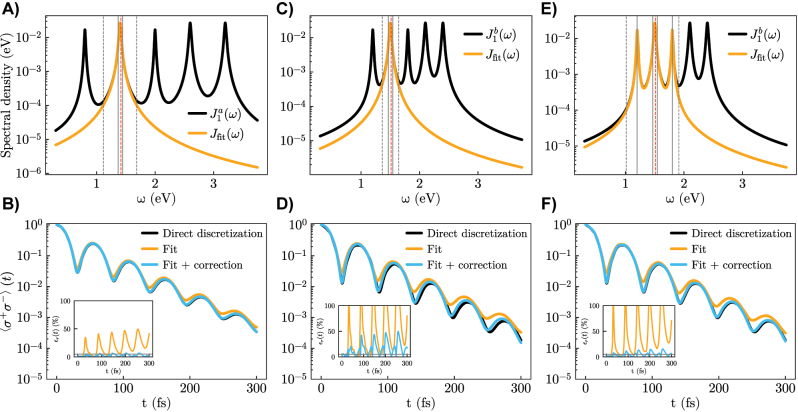
Figure 2:
Numerical simulations on the test Lorentzian-like spectral density. Left column (A and B): Case with well-separated resonances. A) Spectral density splitting with a 1-mode model for J fit. The residual spectral density is not shown. The emitter transition frequency is indicated with a dashed red line and the fit range is comprised between the two dashed gray lines. The solid gray lines indicate the energy positions of the eigenstates of H S . B) Emitter excited-state population calculated from three different approaches: direct discretization (black), only considering J fit (orange) and our full model (blue). The inset shows the relative error with respect to the exact result, where a solid gray horizontal line is traced at 5 %. Central column (C and D): The same as left column but for a squeezed spectral density. Right column (E and F): The same as central column but with a 3-mode model for J fit. Parameters: (A and B) ω e = 1.4155, Δmod = 0.0021, γ mod ≈ 0 [eV]; (C and D) ω e = 1.5135, Δmod = 0.0043, γ mod ≈ 0 [eV]; (E and F) ω e = 1.5135, Δmod = 0.0041, γ mod ≈ 0 [eV].

