
Figure 3:
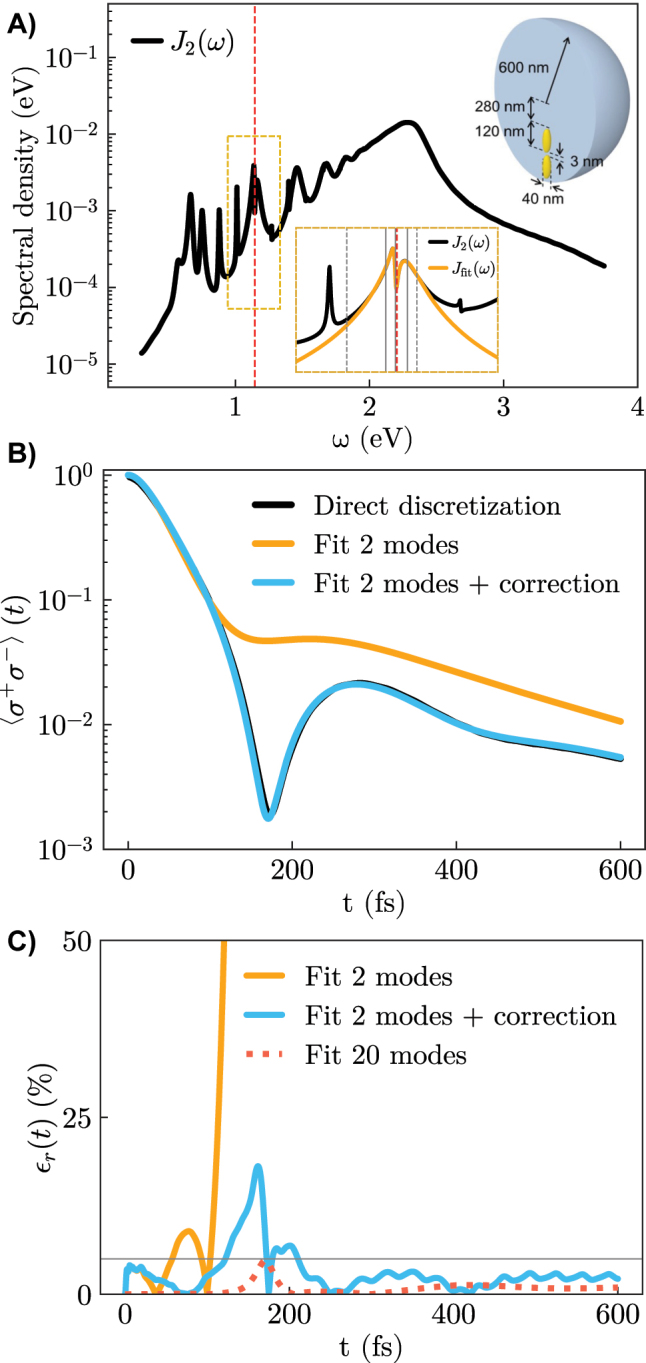
Numerical simulations on the hybrid metallodielectric nanostructure. A) Spectral density of the system. The upper right inset displays a sketch of the metallodielectric nanostructure. The bottom inset zooms in the 2-mode spectral density splitting in the region close to the emitter transition frequency. B and C) The same as the second row in Figure 2 but displaying the relative error in a separated figure (C). The dotted red line indicates the relative error obtained in [32] reproducing the whole spectral density with a 20-mode fit. Parameters: ω e = 1.1445, Δmod = 0.0093, γ mod ≈ 0 [eV].