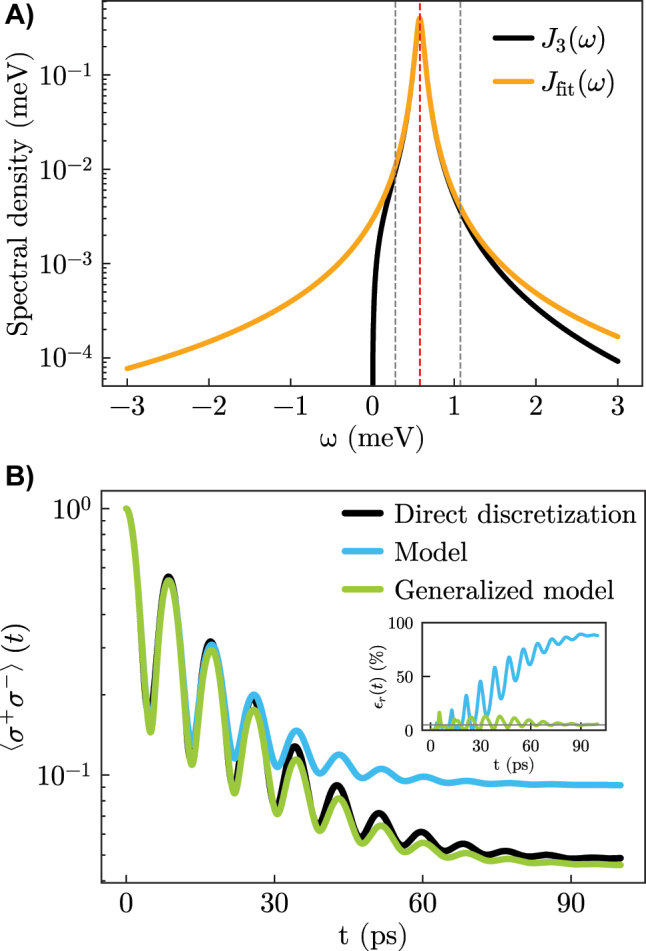
Figure 4:

Numerical simulations on the single-mode setup supporting ultra-strong coupling effects. A) Spectral density splitting with a 1-mode model for J fit. B) Emitter population: the blue line is computed through Eq. (9), while the green line results from the generalized Eq. (11). The absolute relative error associated with the two models is displayed in the inset. Parameters: ω e = 0.58, Δmod = 0.0026, , γ mod ≈ 0, [meV].
