Figure 1.

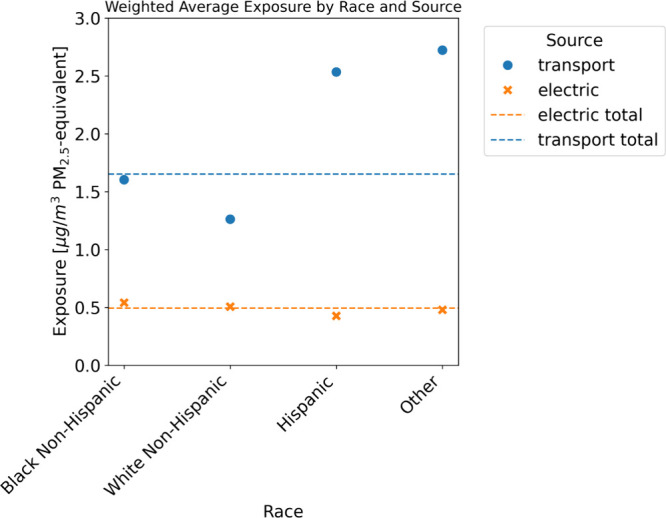
2020 population-weighted average PM2.5 exposure by race and source. The “total” lines indicate the overall population-weighted average exposure by source.

2020 population-weighted average PM2.5 exposure by race and source. The “total” lines indicate the overall population-weighted average exposure by source.