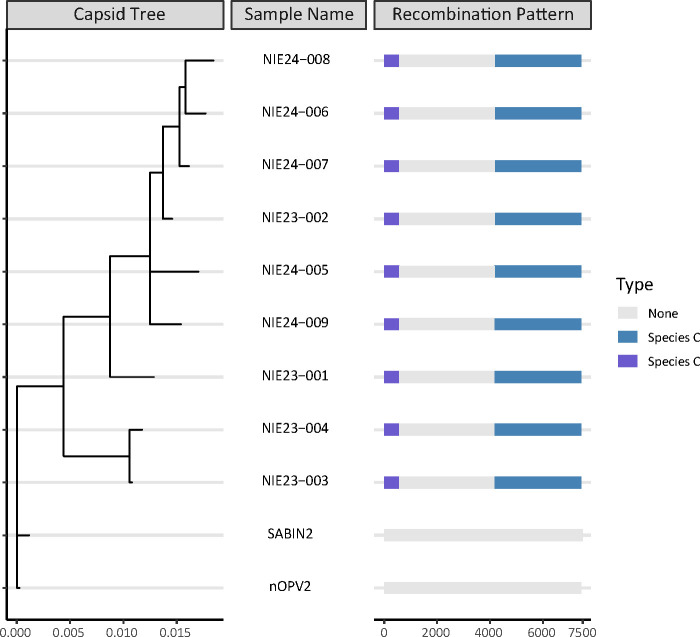
Fig 1.
Double recombinant cVDPV nOPV2 Nigeria samples showing a capsid tree and the recombination pattern of their full-length genomes. All samples are in the NIE-KTS-1 emergence group and show similar double recombination events. Sabin2 (AY184220) and nOPV2 (MZ245455) sequences are shown for reference. “None” delineates areas where no recombination was observed. Purple shows the 5′ untranslated region recombinant area matching an Enterovirus species C. Blue shows the P2/P3 recombinant area of the genome matching a different Enterovirus species C. All nine full-length genomes show a similar recombinant pattern, and all genomes show a 98%–99.8% sequence pairwise percent identity to each other.

