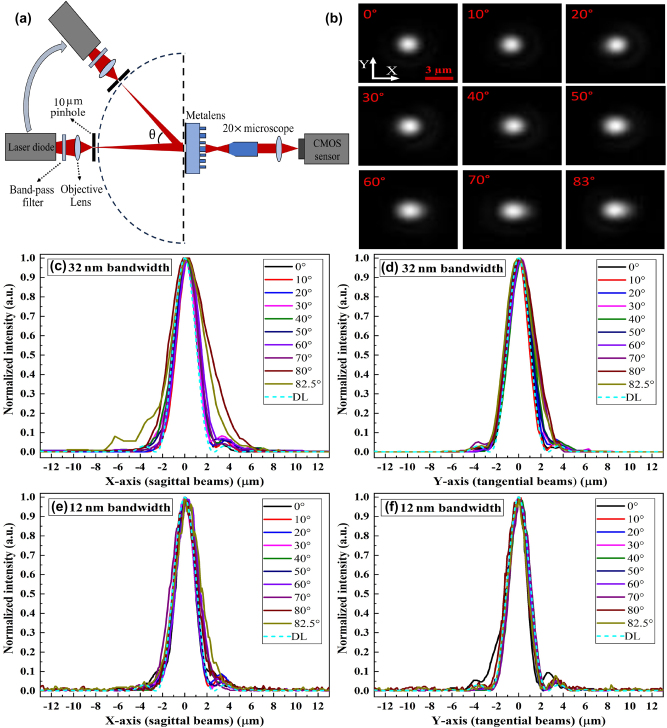
Figure 3:
PSF characterization and analysis. (a) Optical setup for PSF characterization. (b) The captured focal spots at different AOIs, with a scale bar of 3 μm. (c) Sagittal and (d) tangential PSF diagrams for the 32 nm bandwidth. (e) Sagittal and (f) tangential PSF diagrams for the 12 nm bandwidth. The dashed lines indicate diffraction-limited (DL) PSF.

