Figure 1:
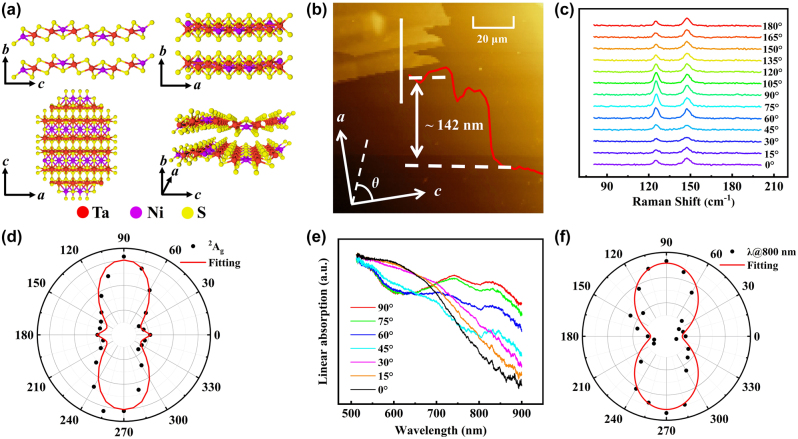
The structure and characterization of Ta2NiS5. (a) Schematics of the layered Ta2NiS5 crystal structure. (b) AFM image and the thickness of the Ta2NiS5 flake. (c) Typical polarized Raman spectra of the Ta2NiS5 flake measured by 532 nm laser with different polarization angles. (d) The anisotropic Raman intensity of 2Ag mode. The black dots and red curve are experimental data and fitting result, respectively. (e) Polarization-dependent linear absorption spectra from 0° to 90°. (f) Polar plot of the linear absorption at 800 nm.

