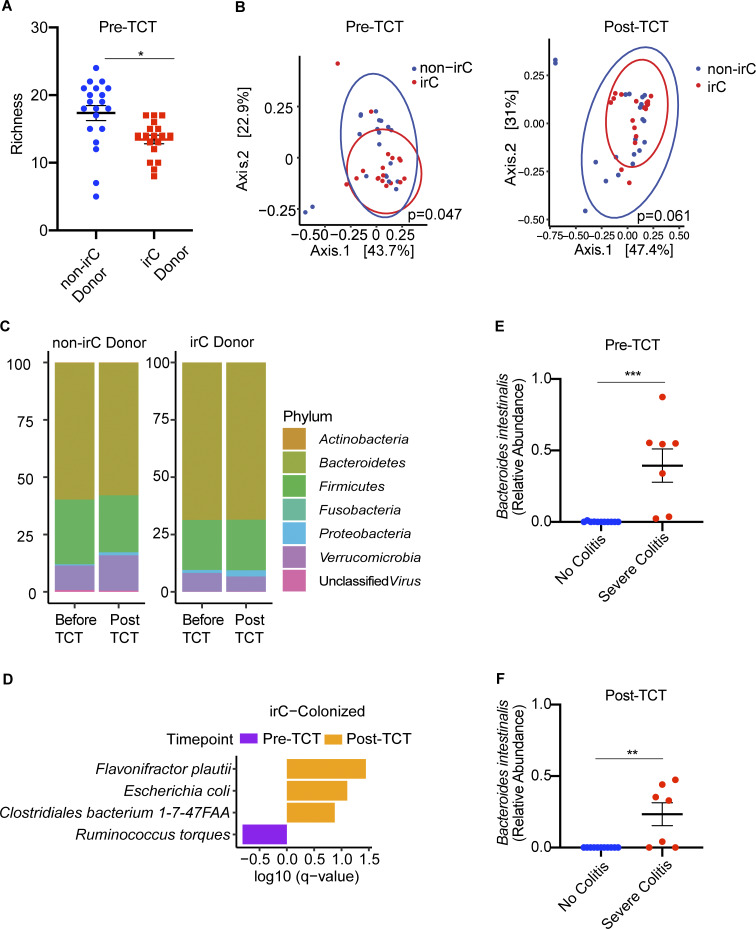
Figure 2.
Metagenomics of murine stool microbiome colonized with either irC or non-irC associated microbiotas. Murine stool microbiomes were longitudinally sampled before and after TCT. (A) Comparison of microbiome richness before colitis induction by TCT, between mice colonized by irC (red) or non-irC (blue) microbiota (the former donor group, patient stool collected before irC development). Individual dots represent individual mice. A linear mixed model via lme4 was applied (P = 0.013) to account for the non-independence of murine samples colonized by the same patient donor. (B) PCoA based on Bray-Curtis distances of species-level microbial communities from murine stool samples before TCT (left) and after TCT (right). Samples are colored based on their designation as receiving microbiome from either non-irC donor (blue) or irC donor (red). The multivariate homogeneity of group dispersions was tested using PERMANOVA (P = 0.047 for pre-TCT and P = 0.061 for post-TCT). (C) Taxonomic composition plot of operational taxonomic units at the phylum-level pre- and post-TCT in non-irC and irC-colonized mice. Each vertical bar represents the average fecal microbiota composition of non-irC or irC donor group at the indicated timepoint (before or after TCT). (D) Top differentially abundant bacterial species in murine microbiomes of irC-colonized mice, either before colitis induction (pre-TCT, purple) or after (post-TCT, orange), identified by MaAsLin2. Horizontal bar length indicates log10(q-value) associated with each species. MaAsLin2 parameters included centered log ratio normalization and linear model analysis. Analysis included n = 18 mice with paired pre- and post-TCT samples. Random effects accounted for microbiota donor (to control for non-independence among mice colonized with the same microbiota donor) and mouse ID (to control for non-independence of paired samples from the same mouse). (E and F) Top differentially abundant bacterial species in murine microbiomes agonistic to donor source and based solely on murine colon histology severity score quartile show relative abundance of Bacteroides intestinalis between no colitis (blue) versus severe colitis (red) mice (E) at pre-TCT (MaAsLin2 P = 0.00048, q = 0.025) and (F) at post-TCT (MaAsLin2 P = 0.0029, q = 0.13). First quartile (orange; no colitis, score = 0); fourth quartile (green; severe colitis, score ≥14); n = 18 mice. Bar length indicates log10(q-value) associated with each taxon. MaAsLin2 parameters included centered log ratio normalization and linear model analysis. Random effects accounted for microbiota donor (to control for non-independence among mice colonized with the same microbiota donor). The study included n = 18 mice with paired pre- and post-TCT samples (n = 7 mice with severe colitis, n = 11 mice with no colitis). Data in A–F plots are combined from three independent TCT experiments, which used 19 human microbiotas (experiment 1: n = 3 human microbiotas, experiment 2: n = 8 human microbiotas, and experiment 3: n = 8 human microbiotas). From each microbiota donor, fecal samples from two mice were represented at each timepoint (pre- and post-TCT) where pre-TCT represents week 0 and post-TCT represents weeks 7–8 post-TCT to be metagenomically sequenced and analyzed. Data in plots A–D used n = 38 mice with paired pre- and post-TCT samples. Taxa presented in D–F had q < 0.25. Error bars represent mean ± SEM. From each microbiota donor, fecal samples from two mice were represented at each timepoint (pre- and post-TCT) where pre-TCT represents week 0 and post-TCT represents weeks 7–8 post-TCT. *P < 0.05, **P < 0.01, and ***P < 0.001. Linear mixed model fit by restricted maximum likelihood with P value estimations using Satterthwaite’s method “lmerModLmerTest.”

