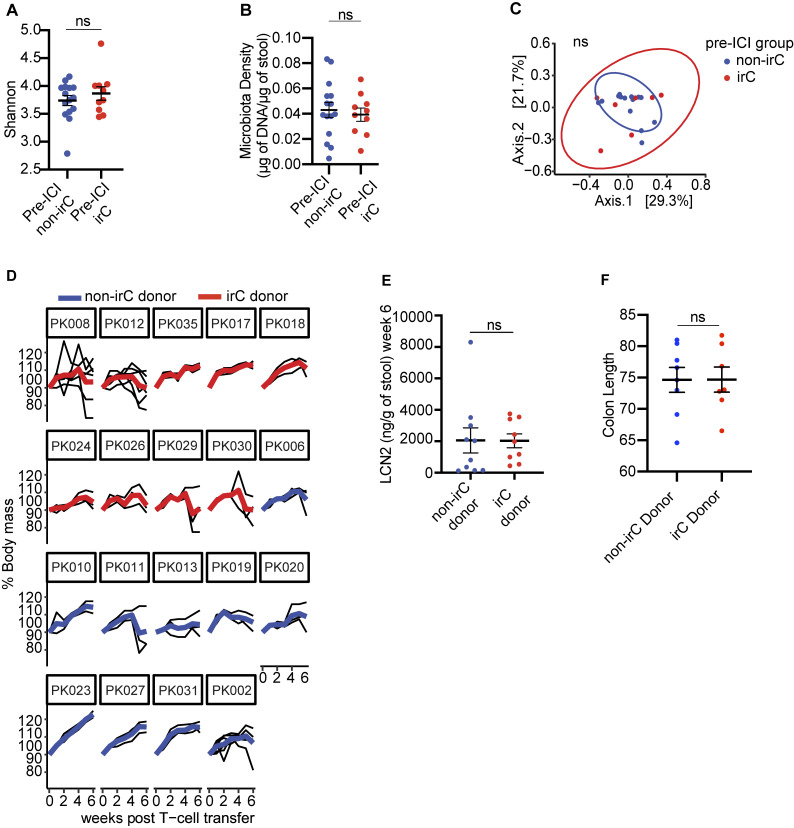
Figure S1.
Colitogencity in microbiomes of irC patients prior to irC development and FMT to gnotobiotic mice exacerbates murine colitis in the TCT model. (A and B) Comparison of 16S rRNA Shannon diversity (A) and microbiota density (B) between gut microbiomes sampled prior to ICI initiation between irC (n = 10) and non-irC patients (n = 15) by Mann-Whitney (A, P = NS, B, P = NS). (C) PCoA plot of Bray-Curtis dissimilarity of fecal microbiota sampled prior to ICI initiation and assessed by metagenomic sequencing in patients who eventually develop irC (n = 10, red) or remain irC-free (n = 15, blue) (PERMANOVA P = 0.71). (D) Weekly body mass percentage (relative to week 0 weight) after TCT in Rag1−/− mice, grouped by microbiota donor (red = irC patient, blue = non-irC patient). Presented as averaged weekly relative body mass (bolded red or blue line) of each microbiota donor and individual murine body mass (thin black line). (E and F) (E) Comparison of LCN2 (right, P = NS) of irC-colonized (red) versus non-irC-colonized (blue) mice 6 wk after TCT or (F) colon length (mm) at sacrifice endpoint. Individual dots represent the average by microbiota donor. Plots D–F used three to seven mice colonized per human microbiota donor, and plots D–F involved analysis of 67 mice (experiment 1: n = 19, 2: n = 24, 3: n = 24) colonized with 19 human microbiotas (n = 10 irC patients, n = 9 non-irC patients). Plot F used 15 microbiota donors, combined using two independent TCT experiments two and three. Error bars represent mean ± SEM. NS P >0.05 by Mann-Whitney.

