Figure S2.
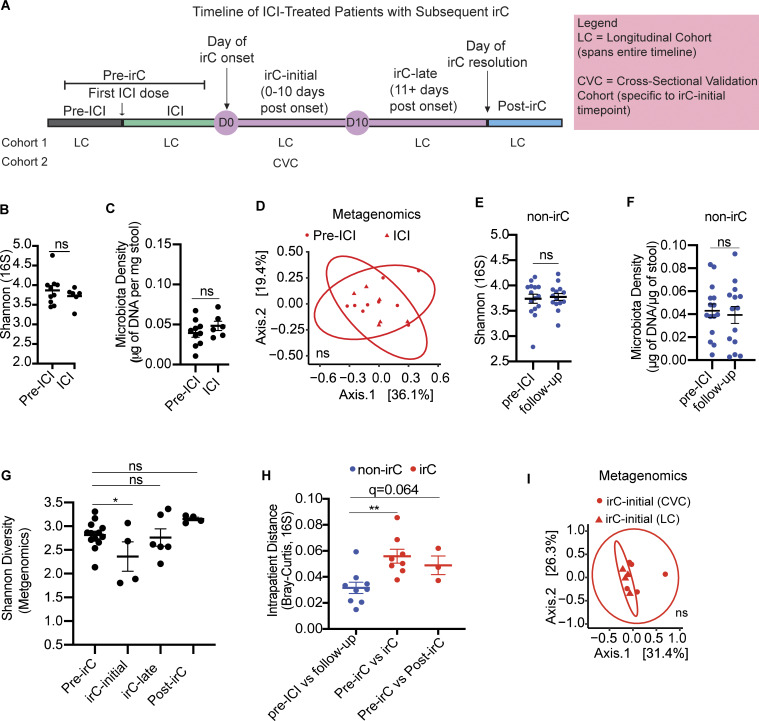
Microbiome markers of non-irC patients and irC-patients and comparison of microbial composition with validation cohort. (A) Schematic representation of the temporal progression of ICI-treated patients who develop irC, marked by significant clinical events: first ICI dose, irC onset, irC resolution. Timepoints are categorized into distinct segments: pre-ICI, ICI, irC-initial (0–10 days post-onset), irC-late (11+ days post-onset), and post-irC (resolution of irC symptoms). Of note, pre-ICI and ICI pooled together are referred to as “pre-irC” to represent the time segment preceding irC onset. The continuous observation of the prospective LC spans the entire timeline, from pre-ICI to post-irC. CVC is a cross-sectional validation cohort and focuses specifically on the irC-initial segment. D0 and D10 indicate the start and end of the irC-initial phase, respectively. (B–D) Shannon diversity using 16S rRNA sequencing data (P = NS) (B) or microbiota density (P = NS) using linear mixed model (C) or PCoA on Bray-Curtis distances of metagenomic profiles (D) to compare microbiota composition of Pre-ICI (circle) and Pre-irC microbiomes (triangle) from LC using PERMANOVA (P = NS) of irC patients microbiomes collected before ICI initiation and at ICI. (E and F) Shannon diversity using 16S rRNA sequencing data (E) and microbiota density (F) of non-irC microbiomes (blue) collected before ICI initiation and 5–7 wk after ICI initiation (follow-up) (E, P = NS; F, P = NS). Linear mixed model fit by restricted maximum likelihood. (G) Temporal Shannon diversity using metagenomic profiles at distinct irC disease stages using linear mixed model to compare Shannon values at pre-irC versus irC-initial (P = 0.015, irC-late (P = NS), post-irC (P = NS). (H) Microbiota profiles change (Bray-Curtis distances) over time within individuals (red = irC patients, blue = non-irC patients) using 16S rRNA sequencing data. Intrapatient comparison of microbiome in nine non-irC patients with paired stool samples collected at pre-ICI and follow-up (5–7 wk post-ICI initiation). For irC, intrapatient comparison of paired stool samples was collected at (1) pre-irC and active irC (irC-initial/irC-late) (in eight patients) (P = 0.0037, q = 0.0074) or (2) pre-irC and post-irC (in three patients, P = 0.064, q = 0.064). Mann-Whitney with BH for adjustment. (I) PCoA plot on Bray-Curtis distances to compare metagenomic profiles of microbiota composition by PERMANOVA (P = NS) of irC-initial microbiomes between patients from CVC and LC (red). Mann-Whitney *P < 0.05, **P < 0.01, NS P > 0.05. Linear mixed model fit by restricted maximum likelihood with P value estimations using Satterthwaite’s method “lmerModLmerTest.”

