Figure S3.
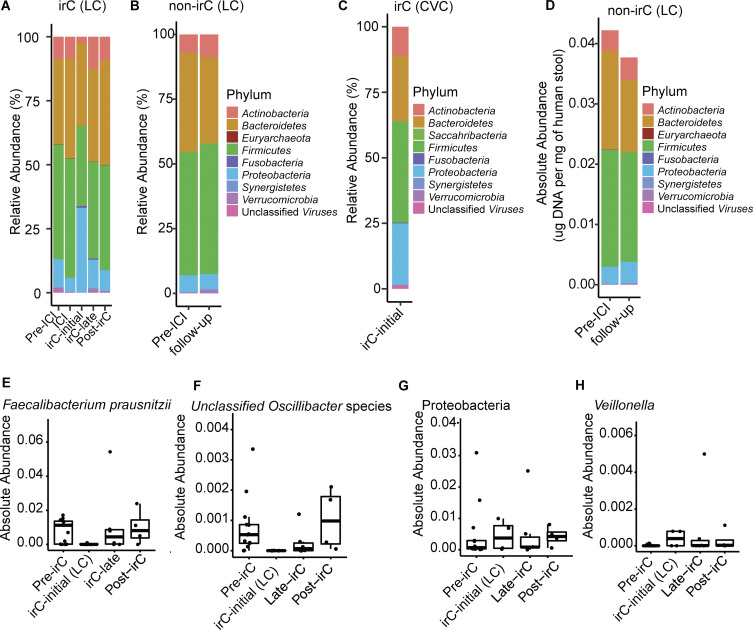
Taxonomic composition at phylum-level and absolute abundance of select taxa in irC and non-irC patients. (A–C) Relative abundance of operational taxonomic units at the phylum level (A) of irC patients from LC at five timepoints (pre-ICI, ICI, irC-initial, irC-late, and post-irC) or (B) of non-irC from LC at pre-ICI and follow-up (5–7 wk after the first dose of ICI) or (C) irC-initial gut microbiomes from irC patients of validation cohort, CVC. Each bar represents the average fecal microbiota composition at the indicated timepoint within a patient group. (D) Absolute abundance at phylum level of non-irC patients at pre-ICI and follow-up (5–7 wk after the first dose of ICI). (E–H) Temporal dynamic changes in the absolute abundances of (E) Faecalibacterium prausnitzii, (F) unclassified Oscillibacter species, (G) Proteobacteria phylum, and (H) Veillonella genus in irC patients of LC at pre-irC, irC-initial, irC-late, and post-irC relative abundance from metagenomic profiles and microbiota density were used to calculate each taxa’s absolute abundance. Each symbol represents data from an individual patient; boxplot displays a central line presenting the median, accompanied by a box that encloses the interquartile range (IQR) and extends whiskers up to the farthest data point within 1.5 times the IQR.

