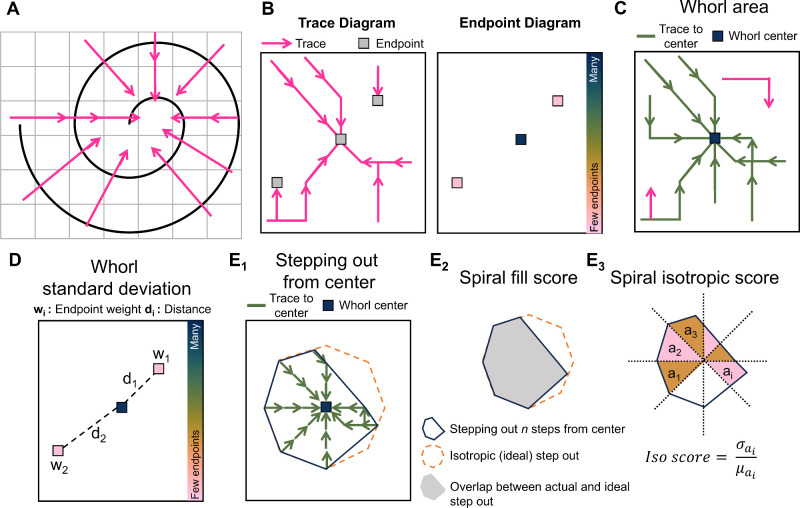
Figure 2.
Analyzing the corneal whorl pattern using whorl metrics. (A) Perpendicular vectors point toward the center of a spiral. (B) Creating traces by connecting the vectors and recording where traces end in the endpoint diagram. (C) The whorl area is the total image area that is connected by a trace to the whorl center. (D) The whorl standard deviation is calculated based on the distances (di) of each endpoint (with area wi) with respect to the whorl center. (E) By following traces for n step outward from the center, the step-out area (E1, blue) is compared to the ideal isotropic step-out (E1, orange). The spiral fill score (E2) is the overlap between the actual and ideal step-out. The spiral isotropic score (E3) is the coefficient of variance calculated from 45 degree slices with area ai of the step-out.

