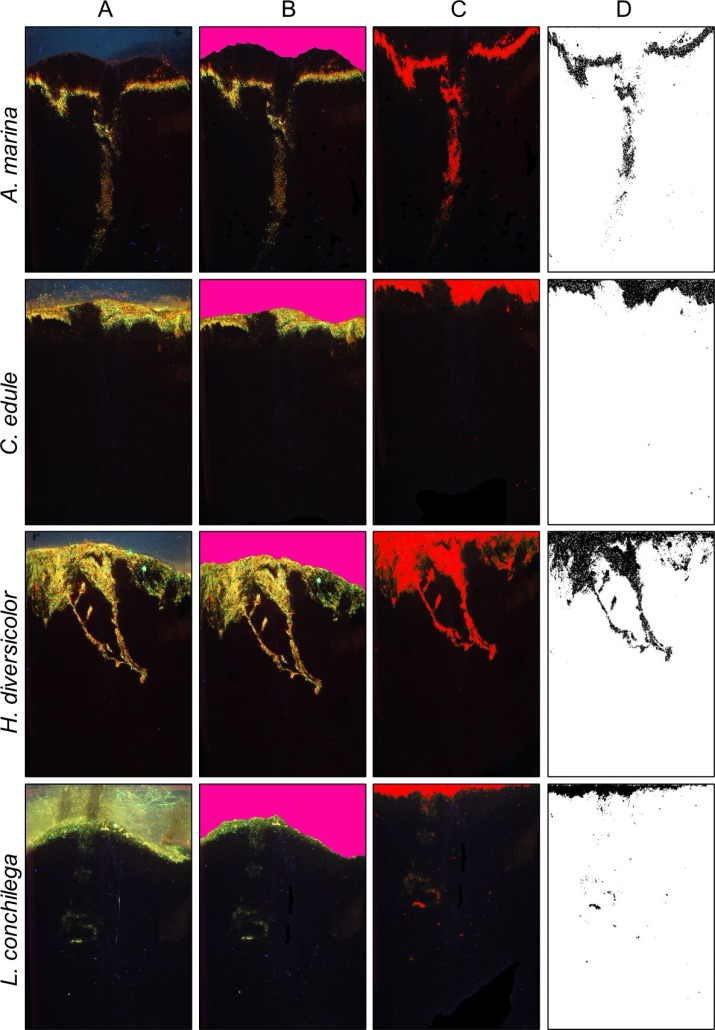
Figure 2. Bioturbation signatures of key species (A. marina, C. edule, H. diversicolor, L. conchilega).
Image analysis process to calculate bioturbation rate of different species; (A) Initial photo of core (B) definition of sediment surface (C) selection of luminophores (D) isolation of luminophores for vertical profiling.

