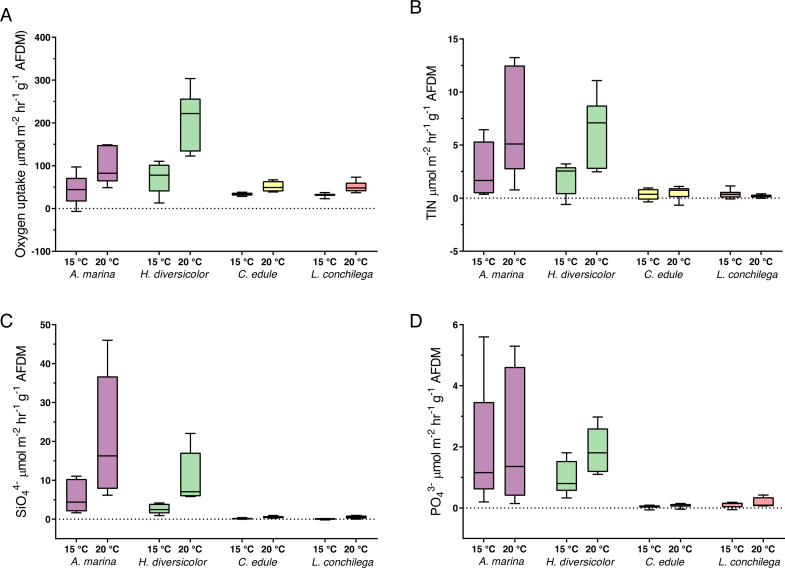
Figure 6. Nutrient fluxes ((A) Oxygen uptake; (B) TIN; (C) SiO; (D) PO; µmol m−2 hr−1 g−1 AFDM) from incubation cores (corrected by blank incubation cores and normalized by AFDM).
Note that for the above nutrient plots (B, C, D) the dotted line highlights the border between the flux being positive (out the sediment) or negative (into the sediment). Note the difference of scales. Boxes represent lower and upper quartiles, lines indiciate the median, and whiskers show minima and maxima.

