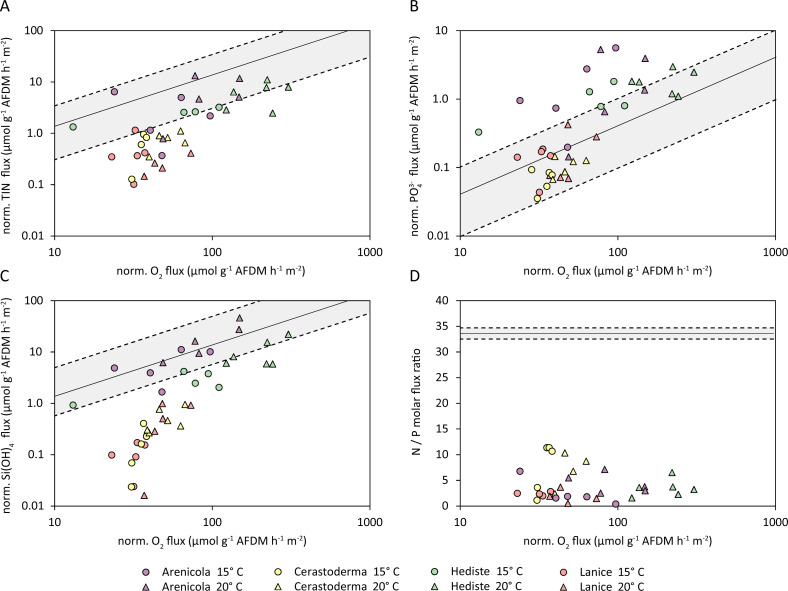
Figure 7. Normalized fluxes (µmol g−1 AFDM m−2 hr−1) of (A) Total inorganic nitrogen (TIN); (B) phosphate (PO); (C) silicate (Si(OH)4); and (D) N:P flux ratios, plotted against the normalized oxygen flux.
The solid black line indicates the hypothetical regional elemental ratio as a reference, the dashed lines indicate the confidence band.

