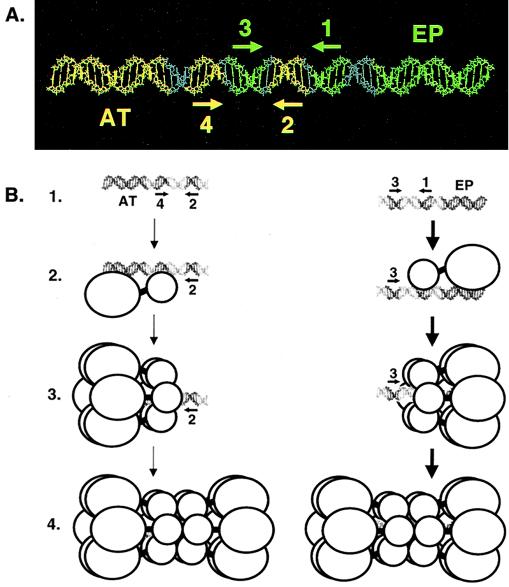
FIG. 8.
A model illustrating the relative positions of the penta 1, 3 + EP and penta 2, 4 + AT assembly units on the core origin and the formation of hexamers and double hexamers on oligonucleotides containing single assembly sites. (A) To depict the relative positions of the penta 1, 3 + EP and penta 2, 4 + AT assembly units, the 64-bp core origin is shown as a B DNA helix. The penta 1, 3 + EP assembly unit is shown in green, while the penta 2, 4 + AT assembly unit is shown in yellow. The locations of individual GAGGC pentanucleotides are indicated by arrows; the positions of the flanking sequences are also indicated. (B) Models for T-ag assembly events on the penta 2, 4 + AT (left) and 1, 3 + EP (right) assembly units (line 1). The structures used to depict T-ag monomers and hexamers are based on transmission electron microscopy studies reported by Valle et al. (73). Smaller circles represent the T-ag-obd, while the remaining residues of T-ag are represented by larger circles. Pentanucleotides proximal to the flanking sequences are recognized by the T-ag-obd, while non-T-ag-obd residues make both sequence-specific and non-sequence-specific interactions with the flanking sequences (this study; reference 35 and references therein). Following monomer binding (line 2), protein-protein interactions give rise to hexamer formation (line 3). Hexamer formation enables additional protein-protein and protein-DNA interactions to take place and subsequent formation of double hexamers to occur (line 4). Boldface arrows show that assembly on the penta 1, 3 + EP assembly unit is preferred over the penta 2, 4 + AT assembly unit.

