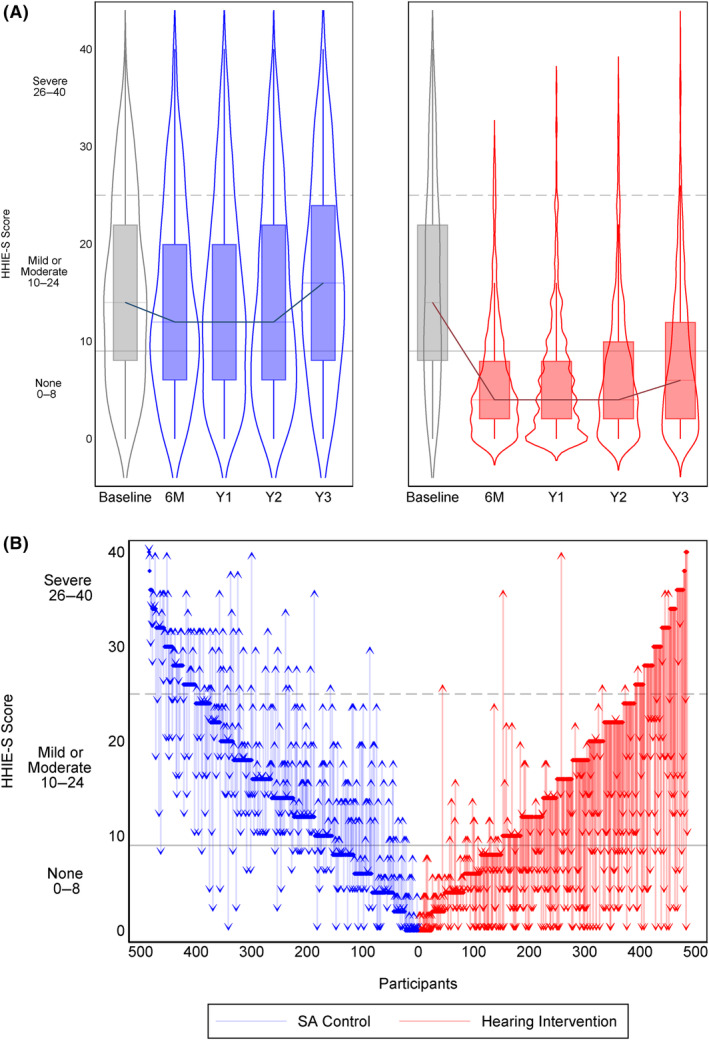
FIGURE 2.

(A and B) Blue represents the control intervention while red represents the hearing intervention group. In the top panel (A), Hearing Handicap Inventory for the Elderly—Screening version (HHIE‐S) score for each group is shown at Baseline (gray) and at 6 months (6 M) and Years 1–3 (Y1, Y2, Y3). Clinical scaling of the HHIE‐S is shown with gray horizontal lines indicating No Handicap (0–8), Mild–Moderate (10–24), and Severe (26–40). The bottom panel (B) shows a waterfall plot for each participant indicating their starting HHIE‐S score at baseline to their final HHIE‐S score at Year 3.
