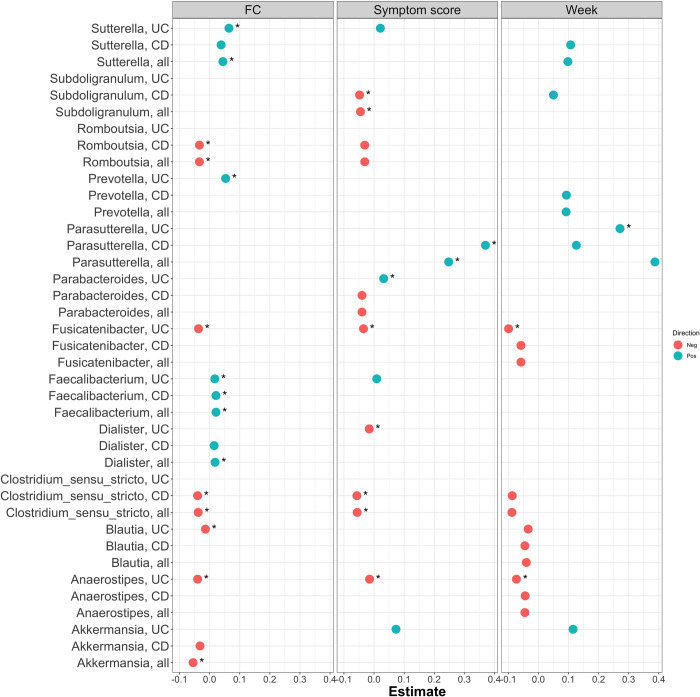
Fig 4. Genera associated with FC, symptom score or week to treatment.
Each genera was analysed in a model that included all patients, as well as separate models for each patient subgroup. The figure shows all bacteria associated with either weeks since treatment, symptom score or FC (p.adj<0.1). For each bacterium reaching the threshold of significance, all three subgroups were retained (CD, UC, and the two combined), and a dot indicates where the nominal p-value is <0.1. Associations remaining significant after multiple-testing adjustment, at p.adj<0.1, are marked with an asterisk. The x-axis shows the estimated coefficient, with positive values indicating an increase in taxa abundance toward next treatment (weeks), or a positive association with symptom score or FC. For family-level results see S5 Fig.

