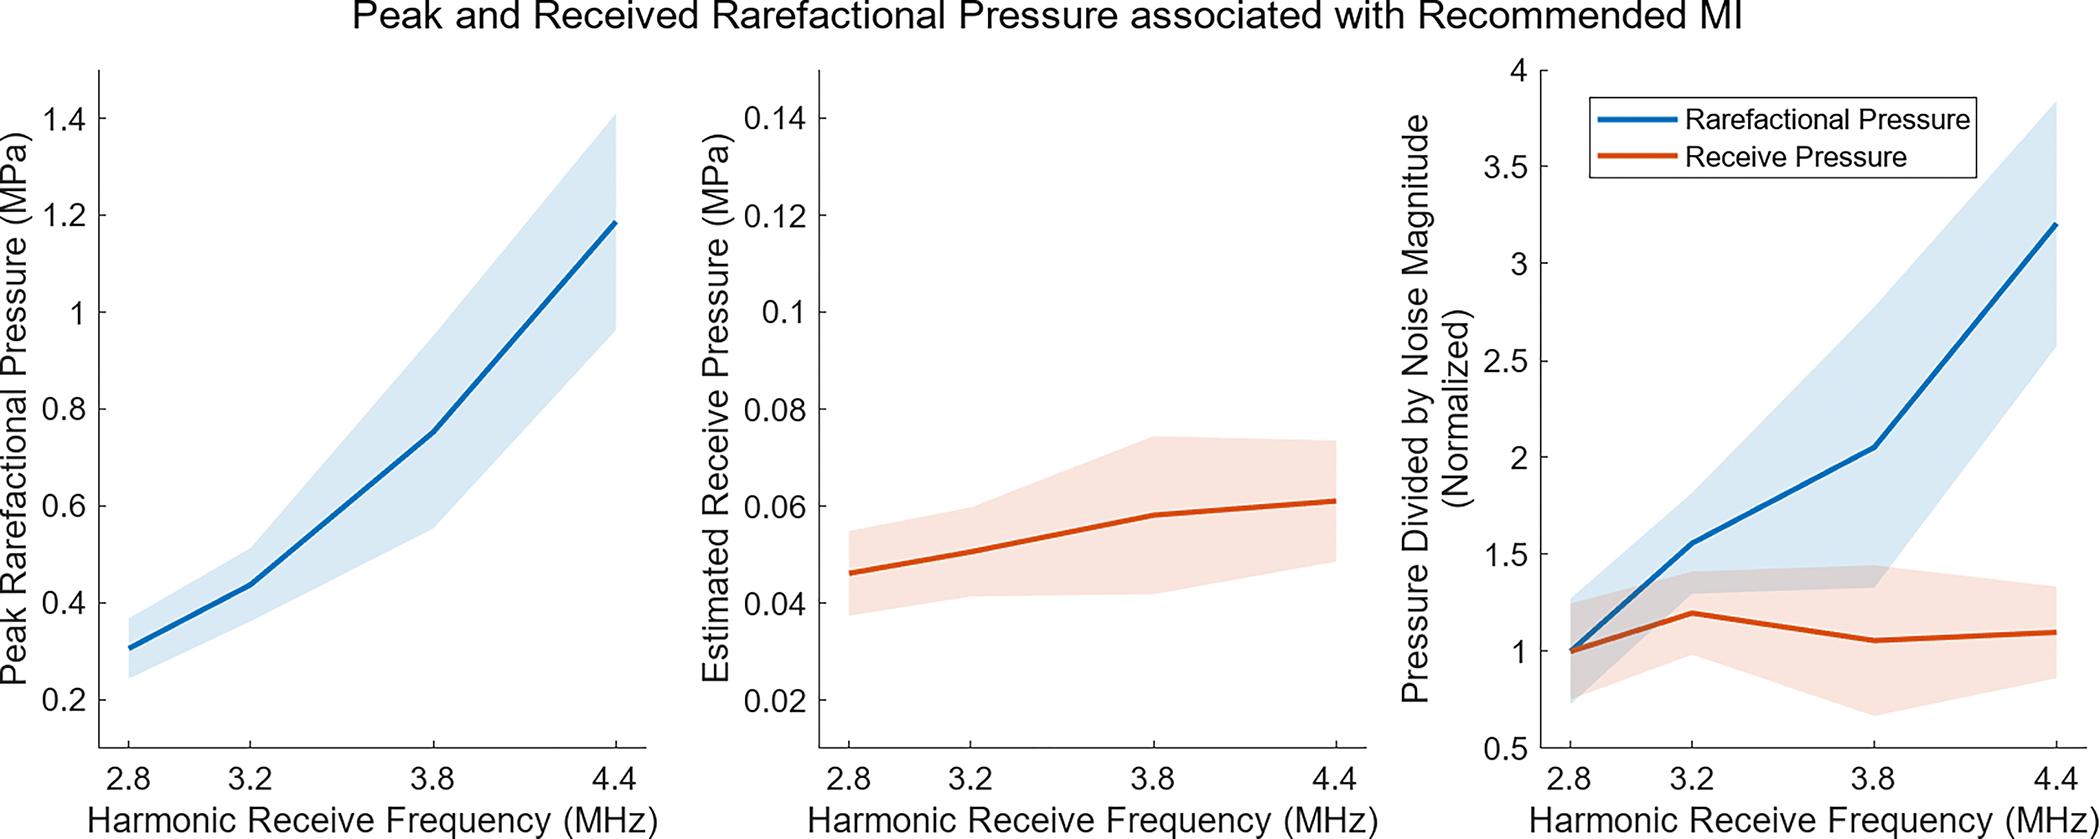
Fig. 11:

Analysis of pressures at the recommended MI, showing the average (solid line) and standard deviation (shaded region) across the 2 repeats in all 11 volunteers. On the left, the peak rarefactional pressure is calculated based on the equation for MI. In the center, the rarefractional pressure is shown after propagation back to the transducer, assuming an attenuation factor of 0.6 dB/cm/MHz. On the right, the result of dividing the pressures by the noise magnitude at each frequency is shown. Accounting for differences in attenuation when calculating receive pressure almost entirely eliminates and explains the frequency dependence associated with the recommended MI.
