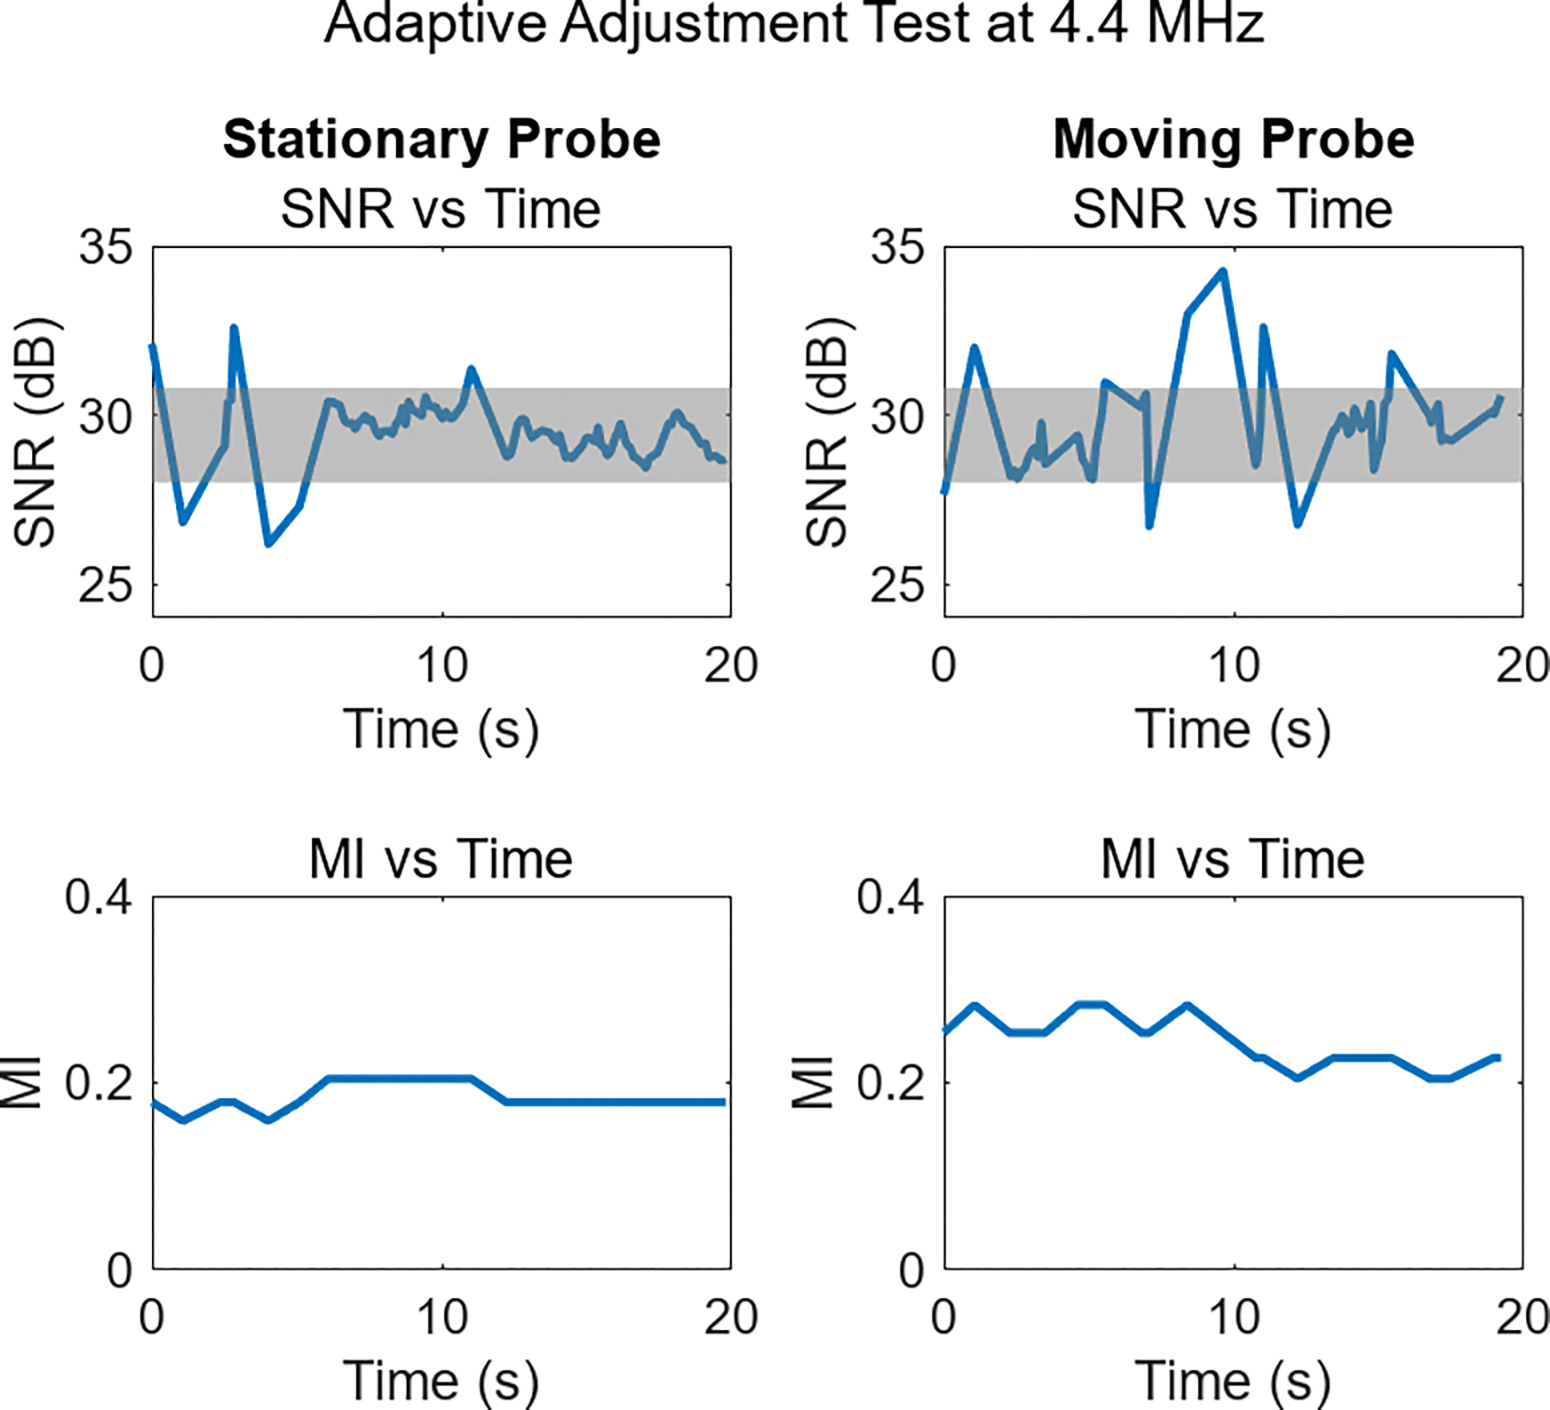
Fig. 8:

Example of adaptive adjustment during fetal imaging. In the SNR plots, the shaded gray region denotes the target SNR range. The left column displays the SNR and selected MI while the probe was held stationary, and the right column shows SNR during a period when the probe was in motion. Increased SNR variability occurs during periods of motion, but in all cases target SNR levels are observed, or MI adjusts to achieve them.
