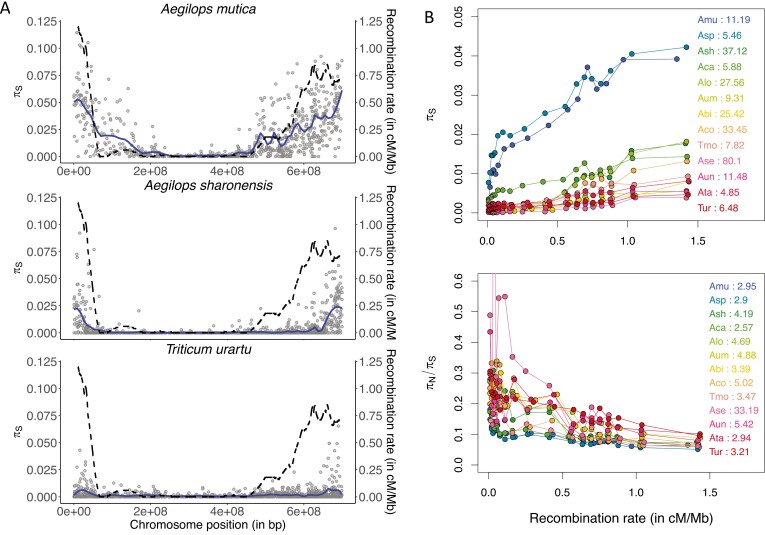
Figure 3.
Recombination and patterns of genetic polymorphism across the genome. (A) Mean synonymous diversity (𝜋S) along chromosome 3 for three species with contrasted mating system: self-incompatible (Ae. mutica), mixed mating (Ae. sharonensis), and highly selfing (T. urartu); same scales for the three species. Each point corresponds to a contig mapped on the Hordeum vulgare genome. The solid line is the loess fitting function (degree = 2, span = 0.1). The dashed line indicates H. vulgare recombination map (in cM/Mb). (B) πS and πN/πS as a function of recombination rate. Contigs have been grouped in 20 quantiles of recombination. The value associated with each species corresponds to the ratio between the highest and the lowest value among the quantiles: from about 5 to 80 for πS and from 2.5 to 33 for πN/πS. Curves correspond to loess fitting functions (degree = 2, span = 0.2).

