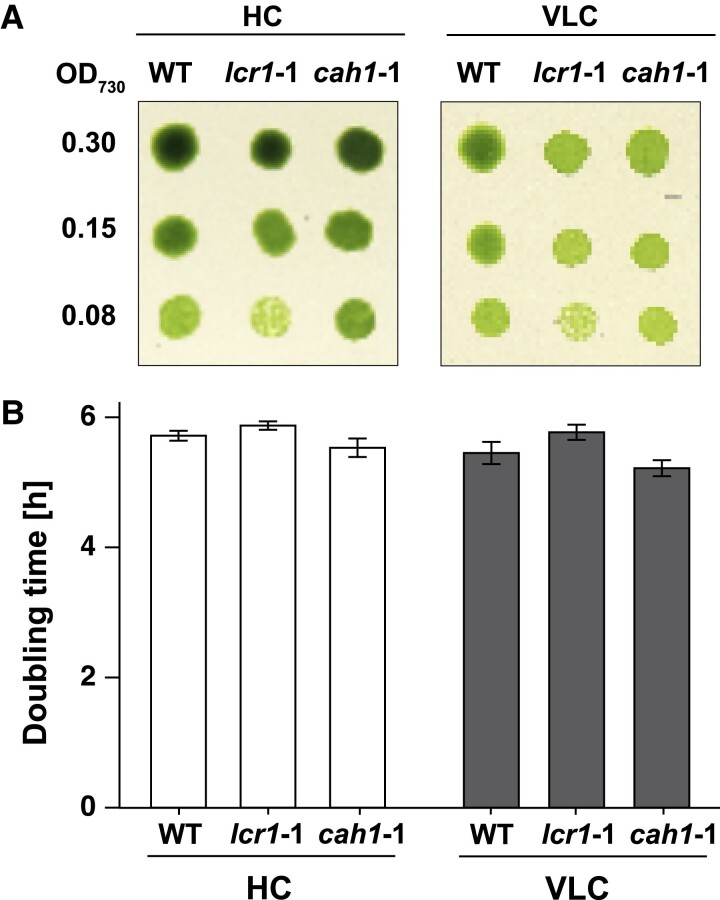
Figure 3.
The growth of lcr1 and cah1 mutants. A) Spot test of WT, lcr1-1, and cah1-1. Cells were diluted to the indicated optical density (OD700 = 0.30, 0.15, or 0.08). Subsequently, 3 μL of the cell suspensions were spotted on agar plates with pH 7.8. The plates were incubated for 4 d under 5% [v/v] CO2 (HC) or 0.01% [v/v] CO2 (VLC) conditions with continuous light at 120 μmol photons m−2 s−1. B) Doubling time of WT, lcr1-1 and cah1-1 cells were calculated from three independent experiments. Each cell was cultured in a 5% CO2 (HC) or 0.04 CO2 (VLC) aeration. Error bars represent standard error (Se).

