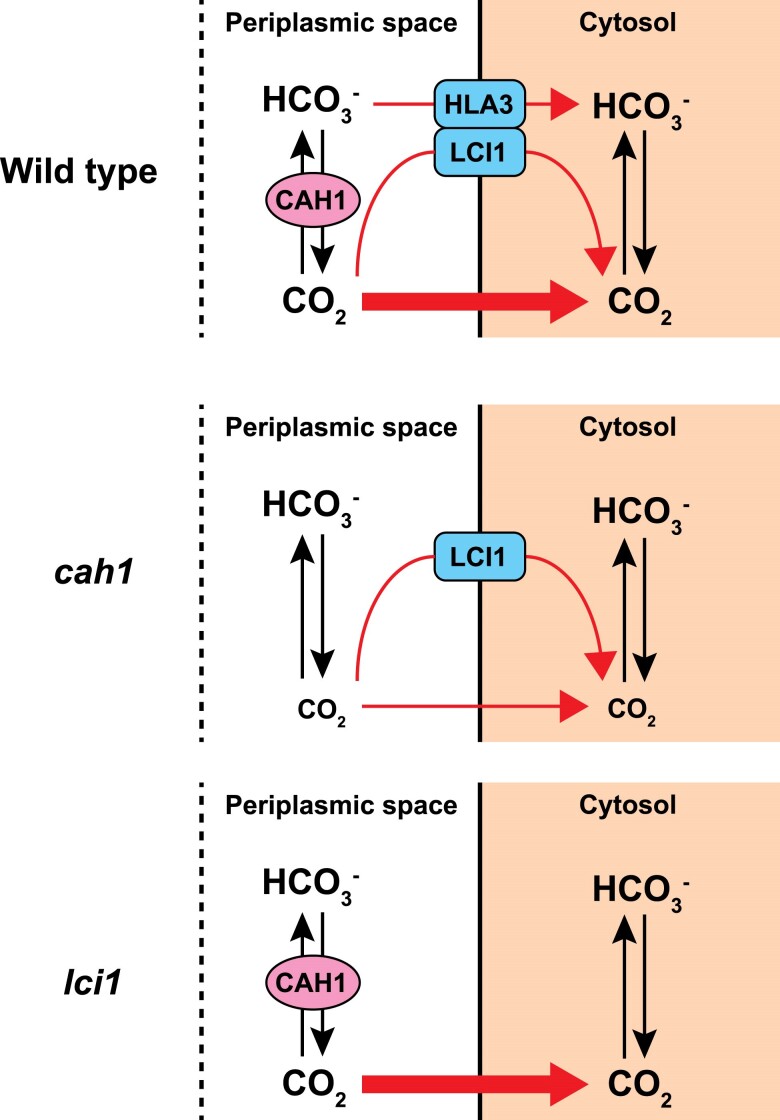
Figure 4.
Models for Ci uptake pathway in WT, cah1 and lci1 mutants. Tentative models show how WT, cah1, and lci1 mutants uptake Ci across the plasma membrane under CO2-limiting conditions and at pH 7.8. Black arrows indicate the interconversion between CO2 and HCO3−. Red arrows show the Ci uptake pathway from the periplasmic space into the cytosol.

