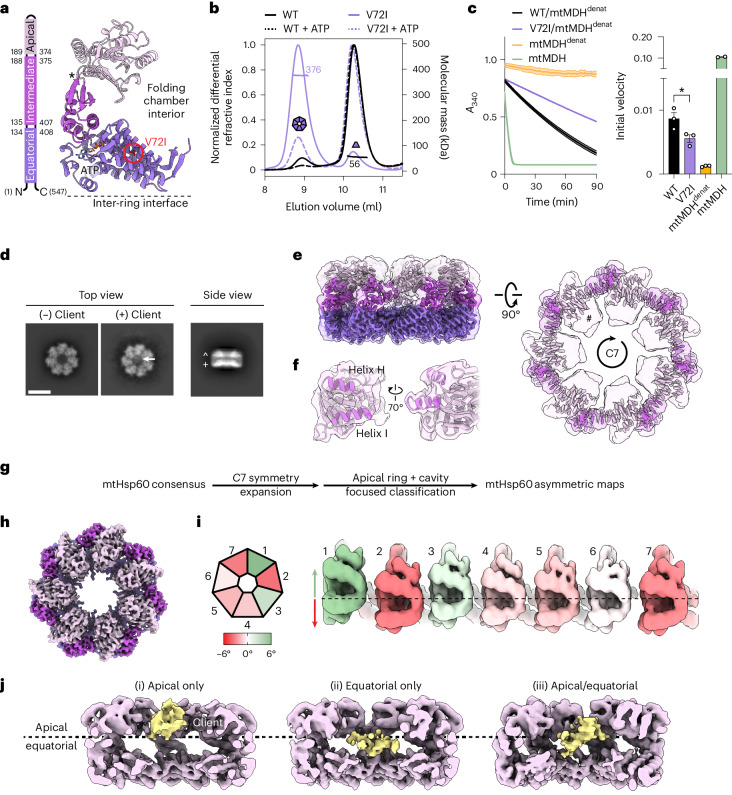
Fig. 1. Analysis and structures of apo-mtHsp60V72I.
a, Structural schematic of mtHsp60 domains showing V72I mutation (red circle), ATP and the apical–intermediate domain hinge (asterisk). b, SEC-MALS of mtHsp60 (black) and mtHsp60V72I (purple) with (dashed lines) and without (solid lines) ATP. Normalized differential refractive index (left y axis) and average molecular mass (horizontal lines, right y axis) are shown versus elution volume (x axis). This experiment was repeated a total of three times with similar results. c, mtHsp60–10 refolding of chemically denatured human mtMDH, measured by the decrease in NADH absorbance at 340 nm (left, one biological replicate, data are presented as the mean ± s.d. of technical triplicates). Initial velocities are shown (right, data are presented as the mean ± s.e.m. of two or three biological replicates, overlaid with individual values). Significance testing was performed by one-way analysis of variance, with correction for multiple comparisons by Dunnett’s test. *P = 0.0305. Folded (green) and denatured mtMDH (mtMDHdenat) (orange) are shown for comparison. d, Top and side view 2D class averages of client-bound and client-unbound mtHsp60V72I with client (arrow), and equatorial (+) and apical (^) domains indicated (Scale bar, 100 Å). e, Top and side views of the sharpened (opaque) and unsharpened (transparent) mtHsp60apo consensus maps are shown, colored as in a. AD density is absent in the sharpened map contour, indicated in the top view (#). f, Map and model view of an mtHsp60apo AD, with inward-facing helices H and I (dark purple) that are poorly resolved and flexible. g, Cryo-EM processing workflow to obtain maps with client and asymmetric AD conformations. h, Top view of the sharpened mtHsp60apo focus map, showing improved AD density. i, Heptamer schematic (left) and unwrapped view of the ADs of the unsharpened mtHsp60apo focus map colored to indicate AD rotation. Positive values (green) indicate an upward rotation (increased equatorial–apical distance) and negative values (red) indicate a downward rotation relative to the consensus map (dashed line). j, Slabbed side views of focused classifications showing unannotated client density (yellow) in different positions across the apical/equatorial regions.

